Network Tree
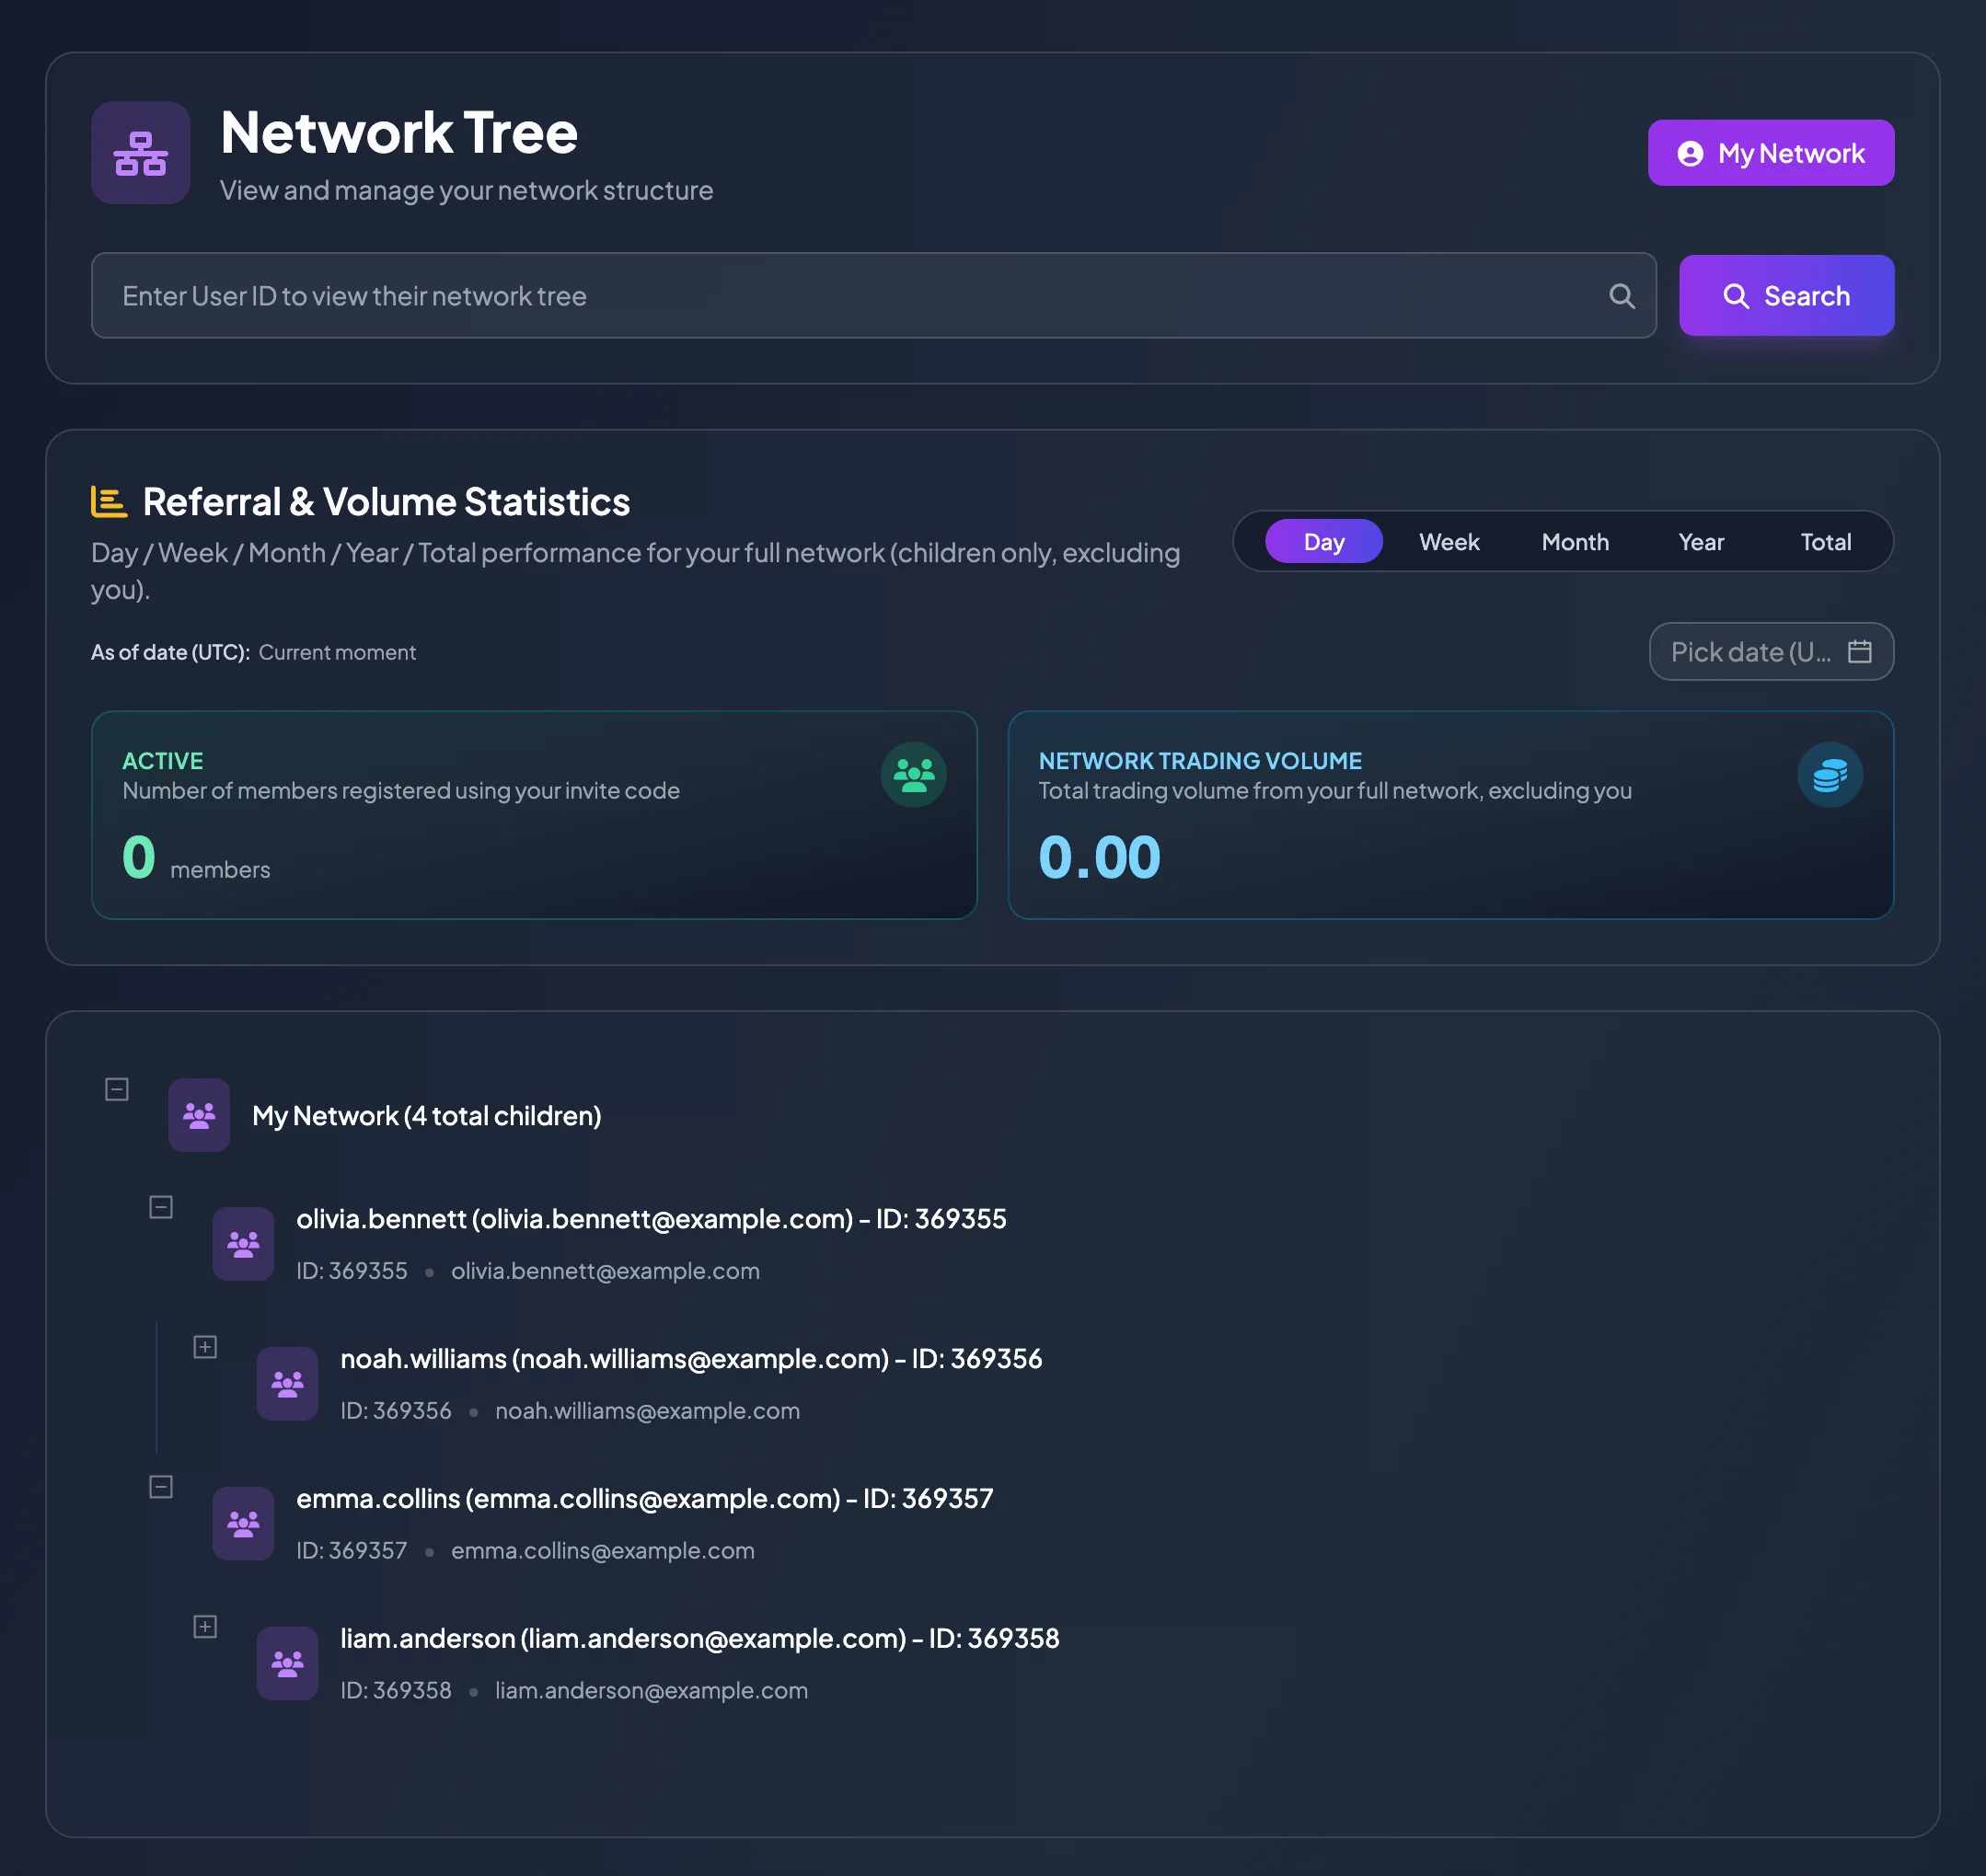
The Network Tree page lets you view downstream members, monitor network activity, review Network Investment Volume, and check historical commission-allocation periods.
This page is especially important when you regularly share your Referral Code or are developing your own member network on BrokerIG.
What does the Network Tree display?
Section titled “What does the Network Tree display?”The page normally contains the following areas:
| Area | Meaning |
|---|---|
| My Network | Displays your downstream member list or tree structure. |
| Referral & Volume Statistics | Shows member activity and Network Investment Volume. |
| Time filters | Lets you review Day, Week, Month, Year, or Total performance. |
| F1 Commission Management | Lets you view or configure commission allocation for direct F1 members. |
| Commission History | Stores commission-rate periods that were previously applied. |
How to read the member tree
Section titled “How to read the member tree”A member node may display:
- User name.
- Email.
- User ID.
- Position in the network.
- Active or Inactive status.
- Verification Status, System Roles, or User Types when details are available.
Members directly below you are F1 members. If an F1 member refers another person, that person is part of the F1 member’s downstream branch and may appear at a deeper level in the tree.
Use Expand All, Collapse All, or the individual node controls to navigate larger networks.
How to search for a member
Section titled “How to search for a member”- Open Network Tree.
- Use the Search field.
- Enter the member’s name, email, or User ID when supported.
- Review the member’s position in the tree.
- Expand the relevant branch if you need to view downstream members.
Searching by User ID is useful when several members have similar names or when the network is large.
How to read Referral & Volume Statistics
Section titled “How to read Referral & Volume Statistics”The statistics cover your full downstream network, excluding your own activity.
Available periods may include:
- Day: recent daily activity.
- Week: useful for monitoring the weekly settlement period.
- Month: useful for reviewing network growth.
- Year: useful for longer-term trends.
- Total: cumulative results for the available history.
Common metrics include:
| Metric | Meaning |
|---|---|
| Active | Number of members registered through your invite code or counted in the selected network period. |
| Network Investment Volume | Total investment volume generated by the full downstream network, excluding your own activity. |
| Weekly System Revenue | Completed revenue for the current week based on investment volume, when available. |
| Weekly Revenue Share | The revenue share associated with the selected weekly period, when available. |
Why can the numbers differ from expectations?
Section titled “Why can the numbers differ from expectations?”Network values may differ because:
- A new user has not completed registration.
- Data synchronization is still in progress.
- The selected period is not the one you intended to review.
- Some metrics count downstream members only and exclude your own activity.
- Weekly revenue or commission has not yet been settled.
- The user registered with a different Referral Code.
- The member is Inactive or has not completed required verification.
What is Commission History used for?
Section titled “What is Commission History used for?”Commission History records commission-allocation periods that were previously applied.
A history row may include:
- Active From.
- Total Allocated.
- Number of F1 Members.
- Updated At.
Use this history to reconcile why a particular week’s commission was distributed using a specific allocation.
UTC notes
Section titled “UTC notes”The page may display dates and period boundaries in UTC. When comparing them with local time, account for the timezone difference, especially around the start or end of a week.