
Analytics Details
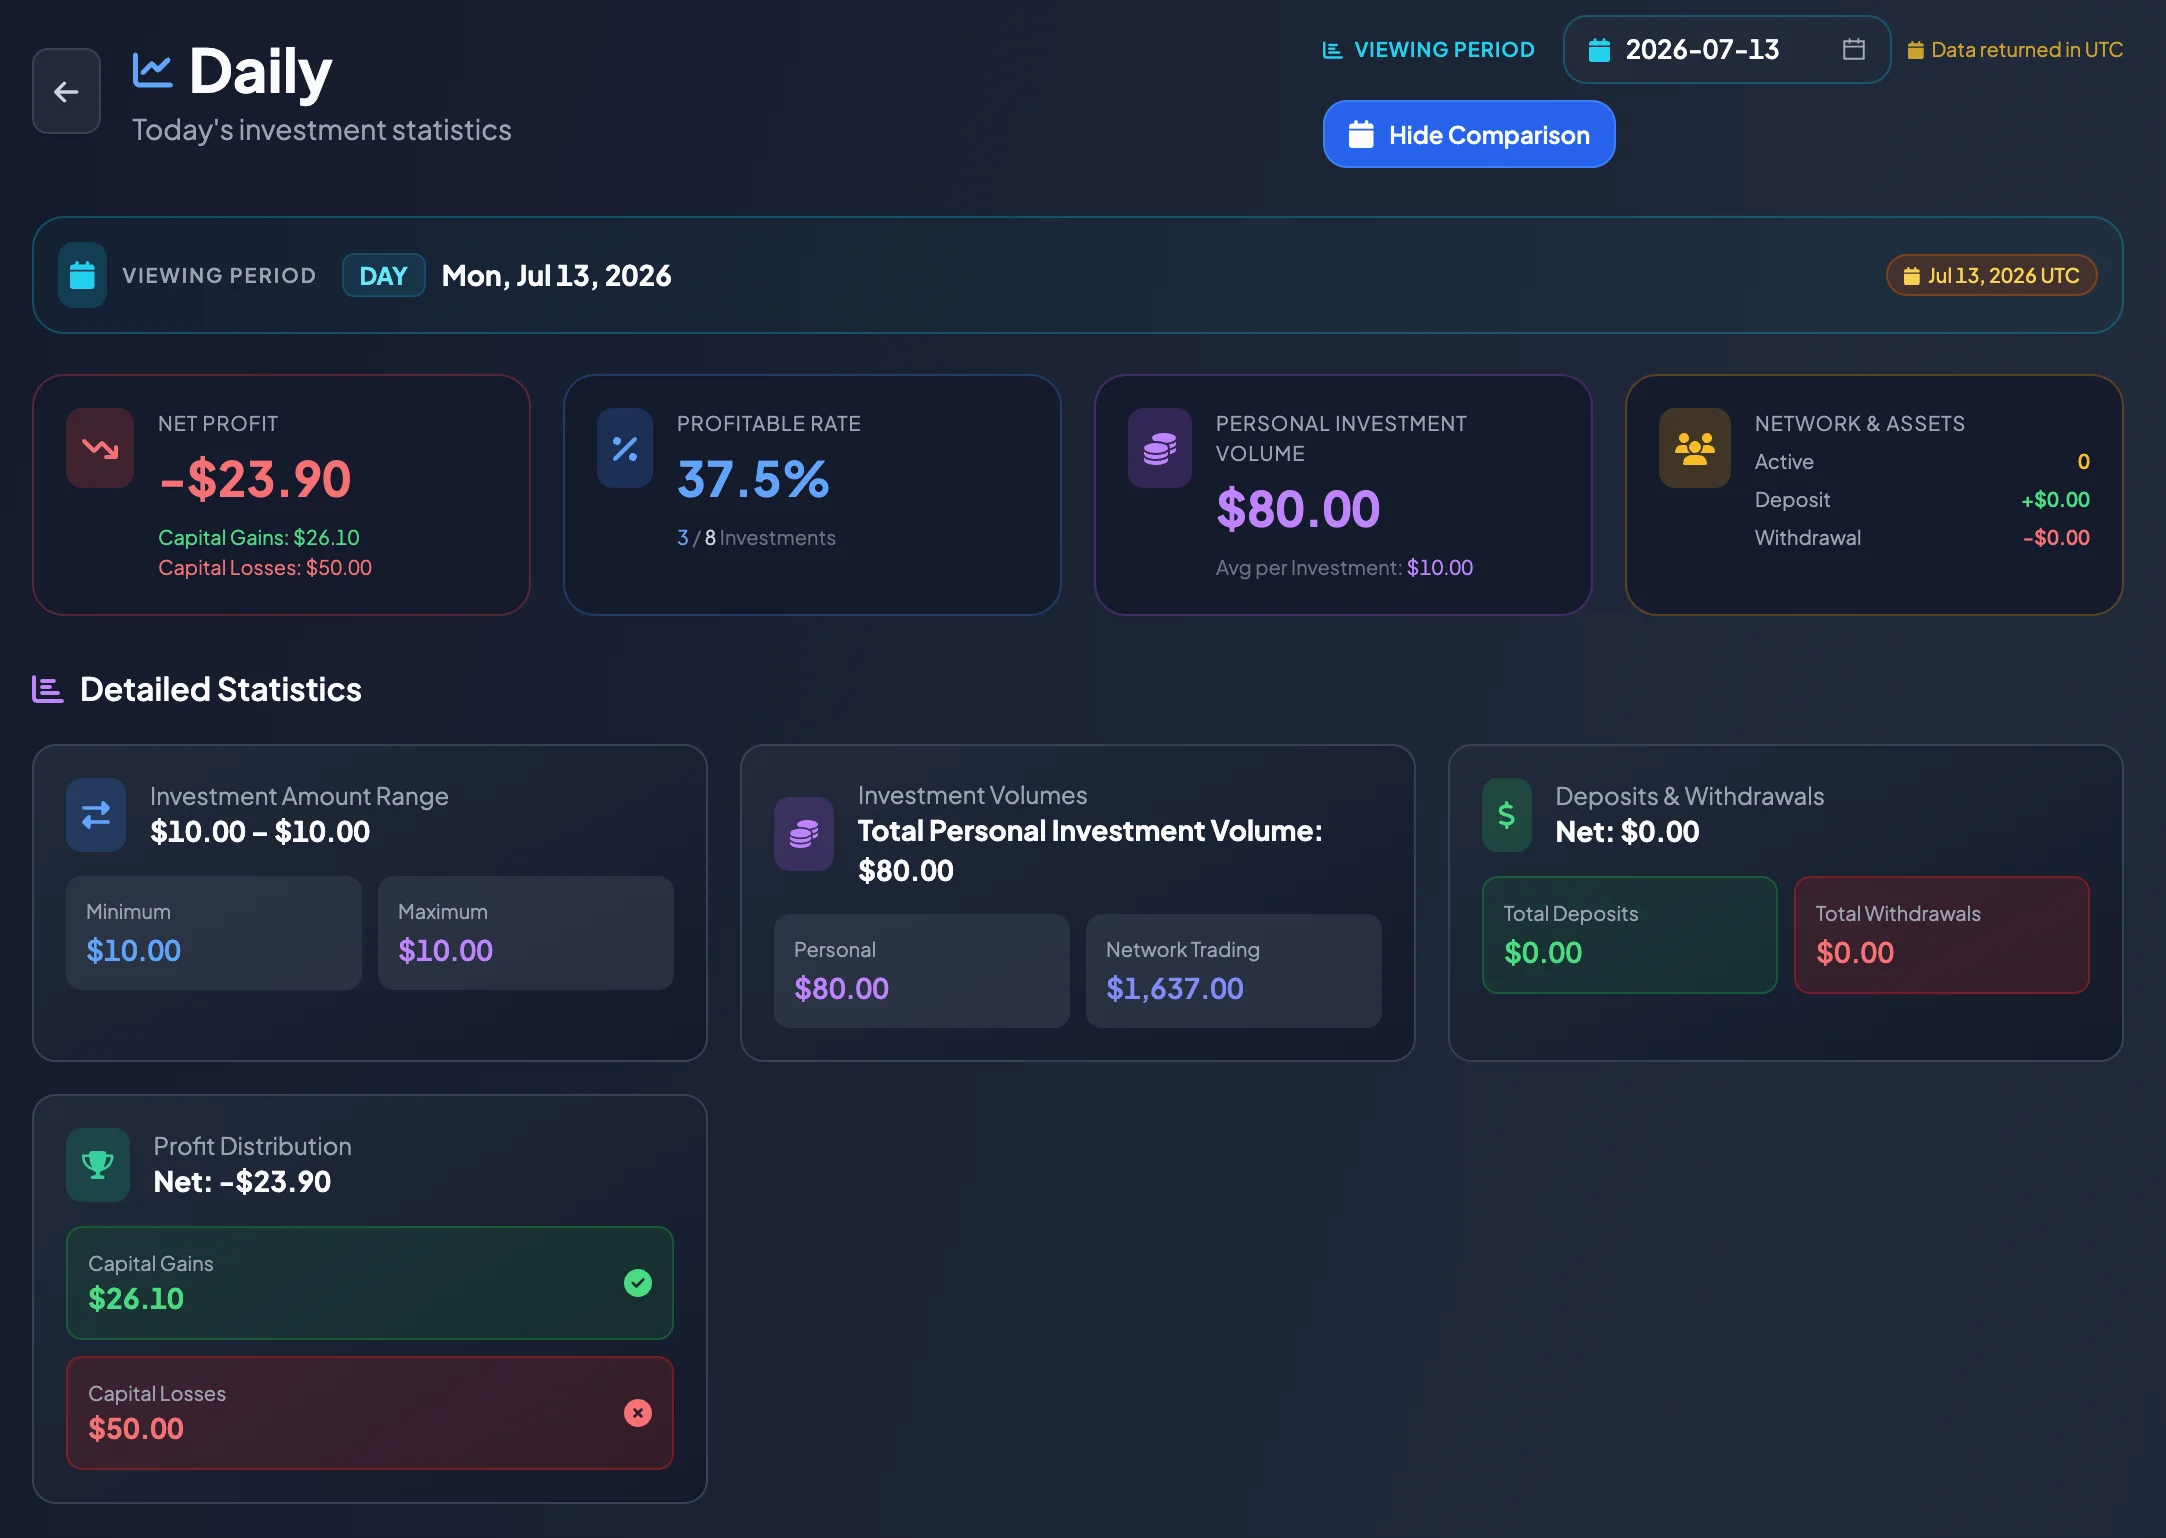
The Analytics Details page opens when you select View Details from Detailed Analytics. Use it to investigate a specific reporting period, such as one day, week, month, year, or All Time.
The page helps answer:
- Is the selected period profitable or unprofitable?
- Where did Capital Gains and Capital Losses come from?
- Did the Profitable Rate improve compared with the past period?
- Did Personal Investment Volume increase or decrease?
- Did deposits and withdrawals affect the balance?
- Are there unusual daily or weekly history entries?
Open Analytics Details
Section titled “Open Analytics Details”- Open General → Analytics.
- Find the timeframe you want to investigate, such as Today or This Week.
- Select View Details.
- The details page opens with data for that period.
Depending on the selected period, the category may be displayed as Daily, Weekly, Monthly, Yearly, or All Time.
Select the Viewing Period
Section titled “Select the Viewing Period”Viewing Period identifies the period currently being analyzed.
- A daily report normally displays one date.
- A weekly report displays the date range for the week.
- A monthly or yearly report displays the corresponding range when supported.
The data is standardized in UTC. Use UTC when reconciling investments and transactions.
Show or hide comparison
Section titled “Show or hide comparison”The details page may include Compare Periods or an option to compare with a past period.
Use comparison to determine:
- whether the current period is better or worse;
- whether Net Profit increased or decreased;
- how much the Profitable Rate changed;
- whether Personal Investment Volume increased unexpectedly;
- whether Total Investments changed significantly.
Select Hide Comparison when you want to focus only on the current period.
Read the primary KPI cards
Section titled “Read the primary KPI cards”Net Profit
Section titled “Net Profit”Net Profit is Capital Gains minus Capital Losses for the period.
- Positive: the period has a net gain.
- Negative: the period has a net loss.
- Zero: there may be no activity or gains and losses are balanced.
The card may separately display:
- Capital Gains: total gains from profitable investments.
- Capital Losses: total losses from unprofitable investments.
Profitable Rate
Section titled “Profitable Rate”Profitable Rate is the percentage of profitable investments out of Total Investments.
For example, 6 / 8 means six profitable investments out of eight total investments, or 75%.
Always read this metric together with Net Profit because it does not show the size of each gain or loss.
Total Investments
Section titled “Total Investments”Total Investments is the number of investments recorded for the selected period.
A very low count may be insufficient for identifying a pattern. A very high count combined with weak Net Profit may indicate excessive investment frequency or weak capital control.
Personal Investment Volume
Section titled “Personal Investment Volume”Personal Investment Volume is the total value invested directly by your account during the selected period.
The card may also display Avg per Investment, calculated as Personal Investment Volume divided by Total Investments.
Network & Assets
Section titled “Network & Assets”Network & Assets may include metrics such as Active, Deposit, and Withdrawal.
- Active is a system activity metric derived from platform data.
- Deposit is the total amount deposited during the period.
- Withdrawal is the total amount withdrawn during the period.
Read Detailed Statistics
Section titled “Read Detailed Statistics”Investment Amount Range
Section titled “Investment Amount Range”Investment Amount Range displays the Minimum and Maximum Investment Amounts for the period.
If the maximum is much larger than the minimum, check whether unusually large investments had a significant effect on Net Profit.
Investment Volumes
Section titled “Investment Volumes”This section separates:
- Personal: your Personal Investment Volume;
- Network Investment: investment volume generated by the associated network, when applicable.
Network Investment may be zero when the account does not use network or partner features.
Deposits & Withdrawals
Section titled “Deposits & Withdrawals”This section displays Total Deposits, Total Withdrawals, and Net Cashflow.
- Positive Net Cashflow: deposits exceed withdrawals.
- Negative Net Cashflow: withdrawals exceed deposits.
- Zero Net Cashflow: there was no cash flow, or deposits and withdrawals were balanced.
Profit Distribution
Section titled “Profit Distribution”Profit Distribution separates Capital Gains, Capital Losses, and the net result.
When Net Profit is below expectations, use this section to determine whether strong gains were offset by equally strong losses.
Read Timeframe Comparison
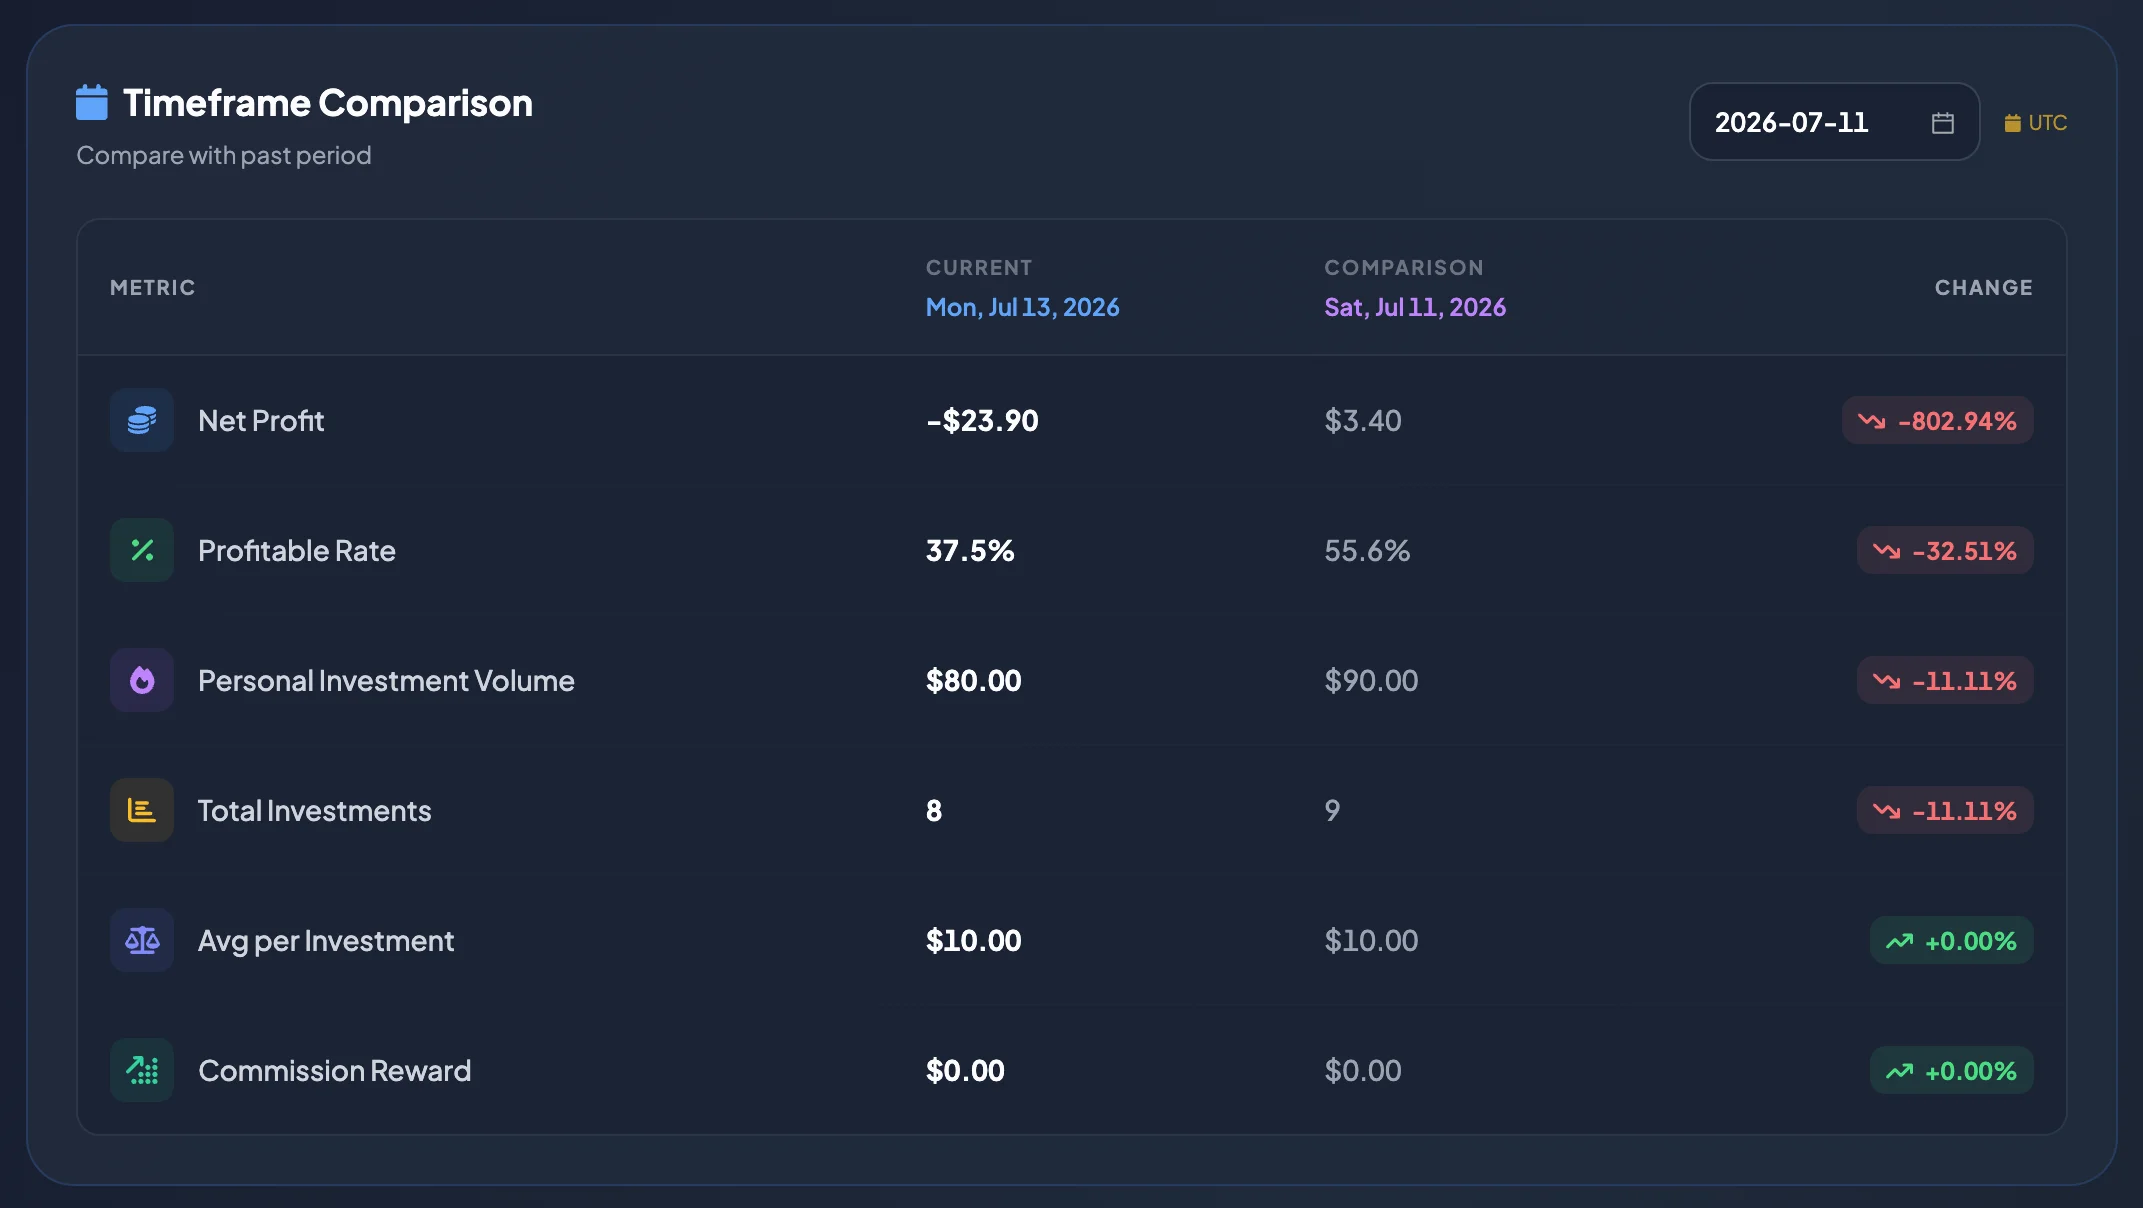
Section titled “Read Timeframe Comparison”The comparison table normally includes:
| Column | Meaning |
|---|---|
| Metric | The metric being compared. |
| Current | Value for the currently selected period. |
| Comparison | Value for the past comparison period. |
| Change | Percentage increase or decrease. |
Common comparison metrics include:
- Net Profit;
- Profitable Rate;
- Personal Investment Volume;
- Total Investments;
- Avg per Investment;
- Commission Reward.
Interpret Change carefully
Section titled “Interpret Change carefully”A positive Change means the current value is higher than the comparison value. A negative Change means it is lower.
An increase is not always positive:
- Higher Net Profit is normally positive.
- Higher Personal Investment Volume with lower Net Profit requires investigation.
- A sharp increase in Total Investments may indicate excessive activity.
- A higher Avg per Investment means more capital is at risk per investment.
When the comparison value is zero, the system may display zero change or an unavailable value depending on the metric.
Read the analytics charts
Section titled “Read the analytics charts”Performance Trend
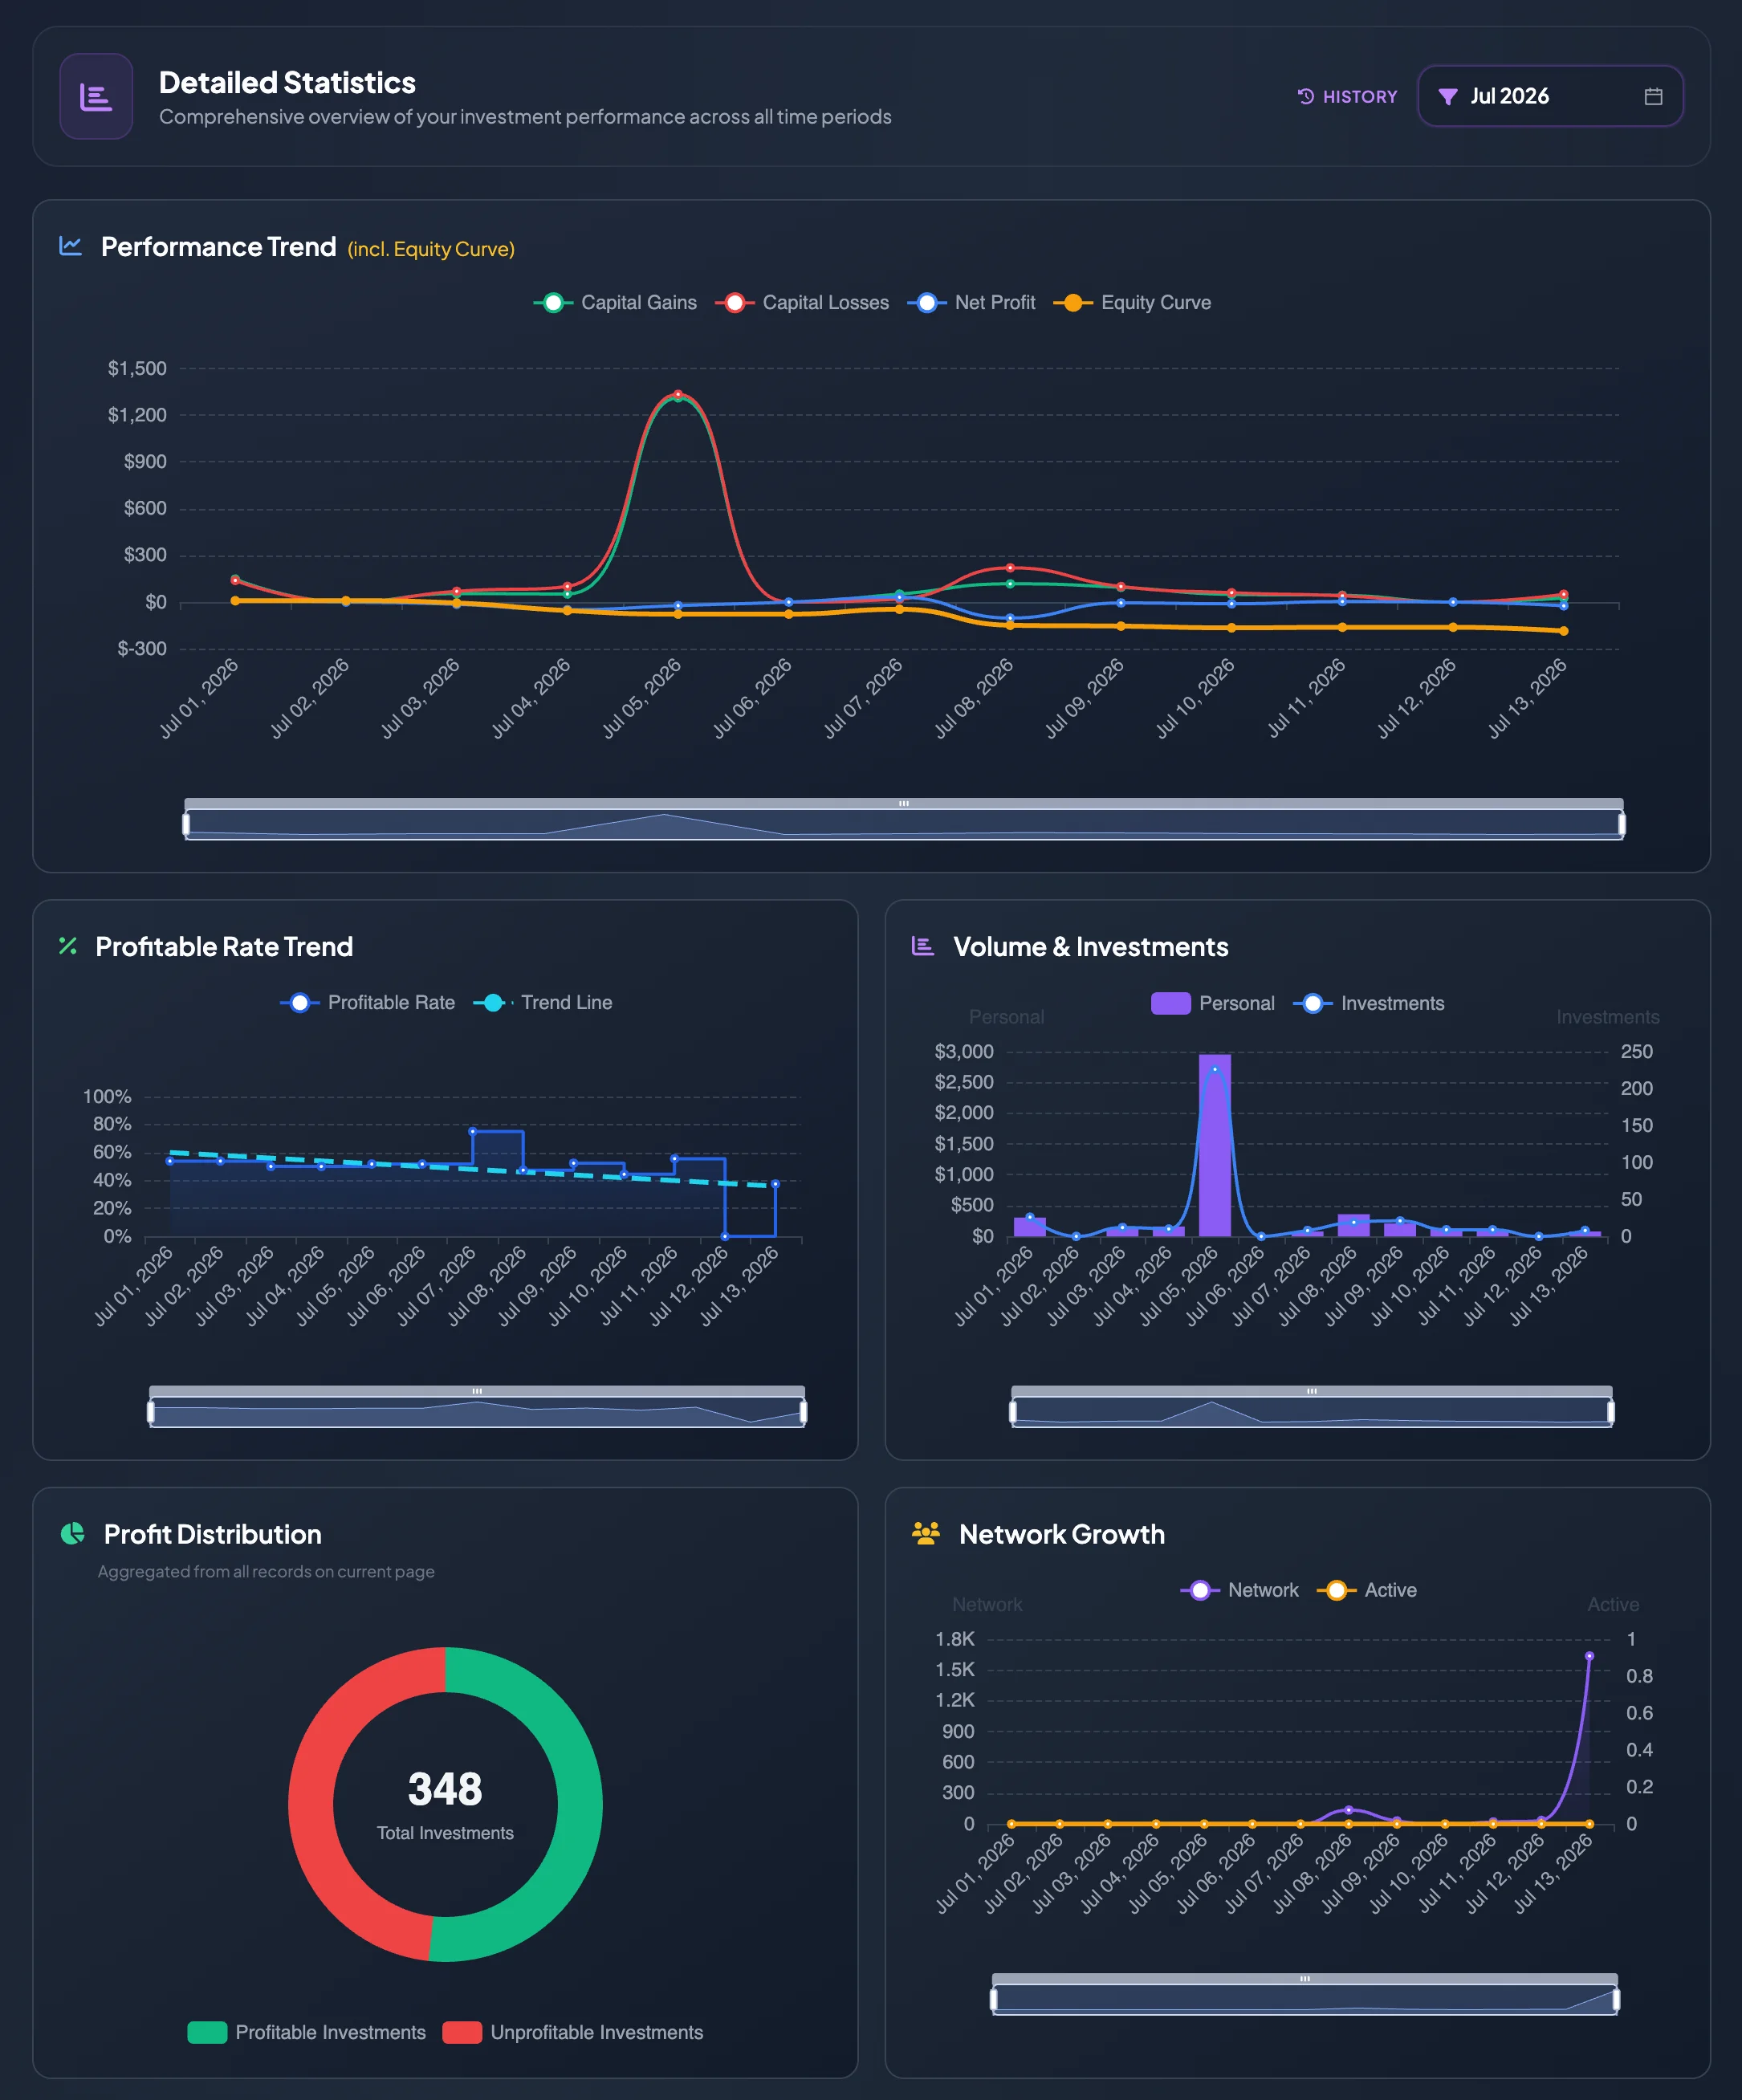
Section titled “Performance Trend”Performance Trend shows how Net Profit changes across the loaded history records. Some interfaces may also display an Equity Curve, showing how the net result accumulates across the loaded range.
Use the chart to identify unusually profitable or unprofitable periods.
Profitable Rate Trend
Section titled “Profitable Rate Trend”This chart shows whether the Profitable Rate is stable, rising, or falling over time.
If the rate falls consistently, review market selection, Investment Amount, timing, and market conditions.
Volume & Investments
Section titled “Volume & Investments”This chart combines Personal Investment Volume and Total Investments.
Use it to distinguish between:
- more investments with similar average size;
- fewer investments with larger amounts;
- a sharp increase in both count and capital at risk.
Profit Distribution
Section titled “Profit Distribution”This section compares profitable and unprofitable investments in the current loaded range.
Use it together with Capital Gains and Capital Losses to understand whether the account’s results are balanced or skewed.
Network Growth
Section titled “Network Growth”Network Growth may display Network Investment Volume and activity metrics. Accounts that do not participate in partner or referral programs may have limited data here.
Read History
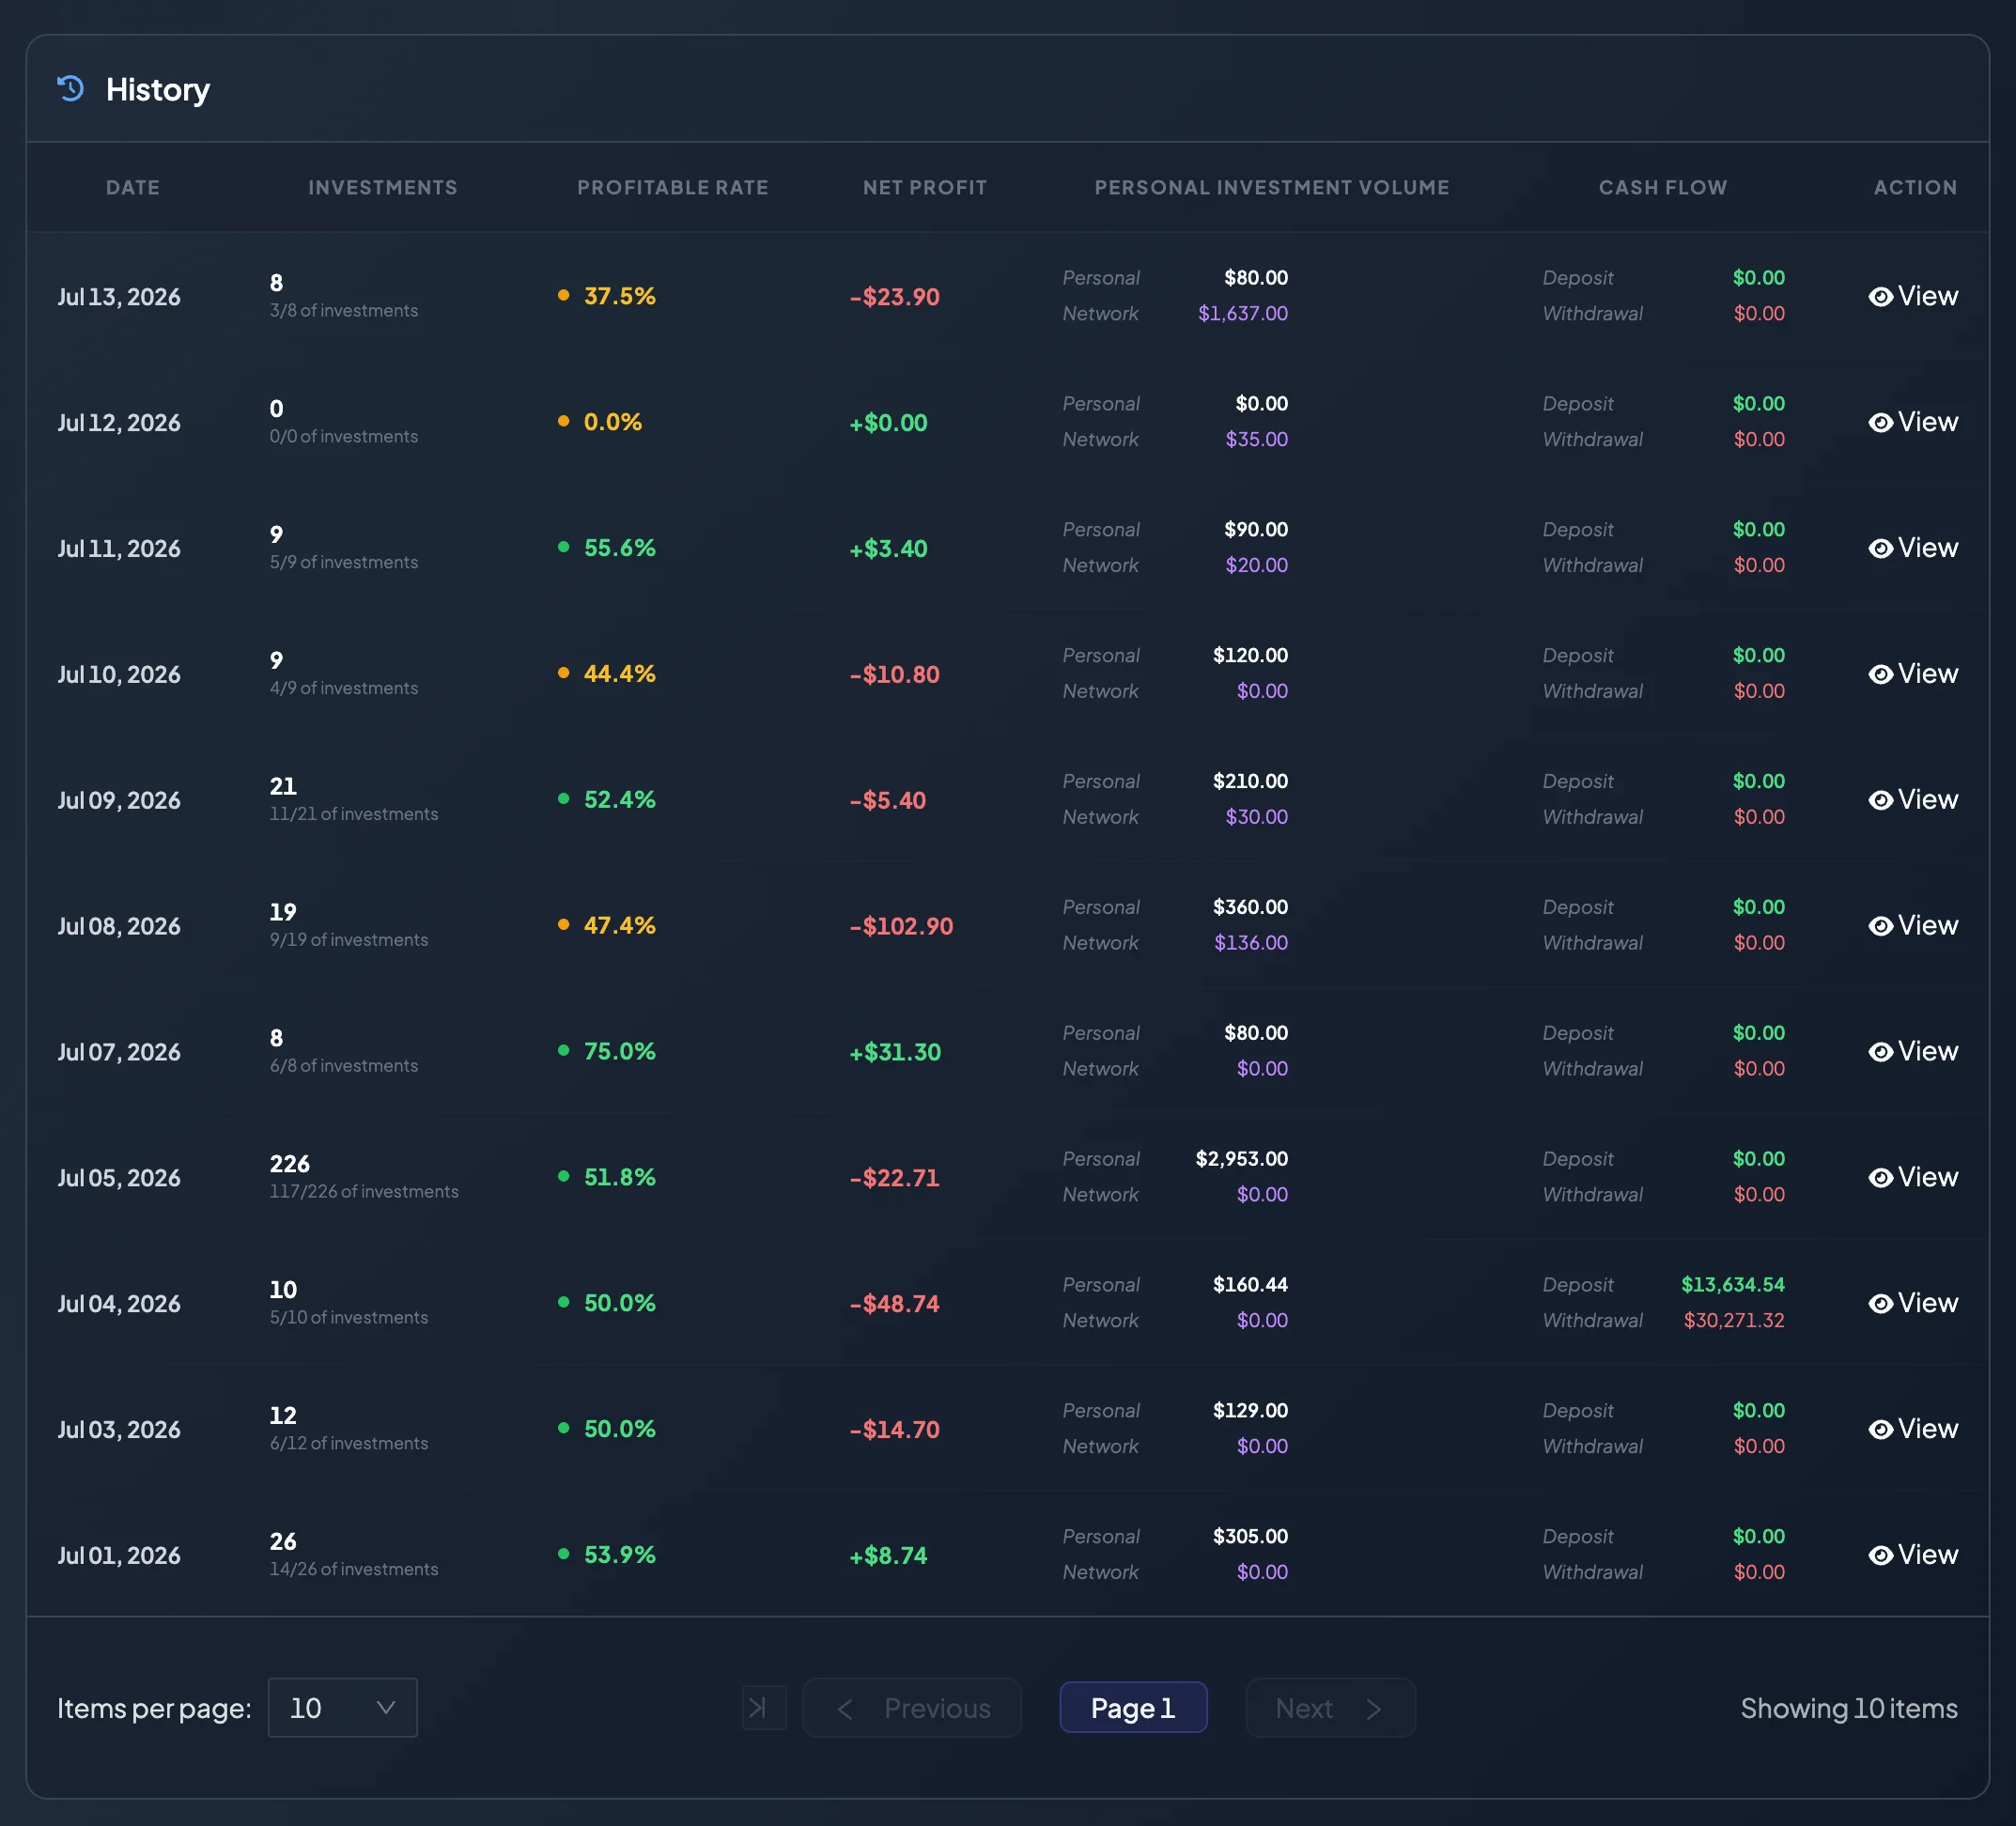
Section titled “Read History”The History table lists records that match the selected report category.
For a daily report, rows may represent individual days. For a weekly report, rows may represent individual weeks.
Each row may contain:
- date or date range;
- Total Investments;
- profitable investments out of total investments;
- Profitable Rate;
- Net Profit;
- Personal Investment Volume;
- Network Investment Volume;
- Deposit and Withdrawal amounts;
- View or View Details.
Select View when a row requires deeper review.
Daily reports
Section titled “Daily reports”Use a daily report when:
- Net Profit changes significantly during one day;
- you want to review recent dates;
- you need to reconcile a deposit or withdrawal on a specific day;
- you want to identify the strongest or weakest day in a month.
Review:
- The UTC date.
- Net Profit.
- Total Investments and Profitable Rate.
- Personal Investment Volume and Avg per Investment.
- Deposits and withdrawals.
- Other daily rows for comparison.
If a day has a net loss, also review Capital Gains, Capital Losses, and the Maximum Investment Amount.
Weekly reports
Section titled “Weekly reports”Use a weekly report when you want a short-term view without the noise of individual days.
Review:
- The week’s UTC date range.
- Weekly Net Profit.
- The selected comparison period.
- Personal Investment Volume compared with the previous week.
- Total Investments and Avg per Investment.
- Weekly deposits and withdrawals.
- Other weeks in History to identify a trend.
If the current week has strong Net Profit but sharply lower Investment Volume, review Performance to determine whether the result came from improved quality or simply lower exposure.
When values are zero
Section titled “When values are zero”A period may display zero values when:
- there were no investments;
- there were no deposits or withdrawals;
- data has not updated yet;
- the selected period is outside the available history;
- the account has no network activity or Commission Reward.
If you know that activity occurred, verify the UTC timestamp and the relevant transaction history before contacting Support.
Review a weak period
Section titled “Review a weak period”When Net Profit is negative:
- Compare Capital Gains and Capital Losses.
- Review Profitable Rate.
- Review Investment Amount Range for unusually large investments.
- Review Personal Investment Volume and Avg per Investment.
- Use History to identify the day or week with the greatest impact.
- Compare with the previous period to determine whether the result is temporary or part of a longer trend.
Review a strong period
Section titled “Review a strong period”When Net Profit is positive, also check:
- Whether Profitable Rate improved.
- Whether Investment Volume increased too quickly.
- Whether Capital Gains came from many investments or only a few large results.
- Whether Capital Losses remained controlled.
- Whether the result is stable across History.
This helps distinguish a repeatable process from a one-time fluctuation.