
How to Read the Price Chart
The chart on the Invest page helps you monitor price movement for the selected Market Pair. It is an important tool for building a scenario before selecting Bullish or Bearish.
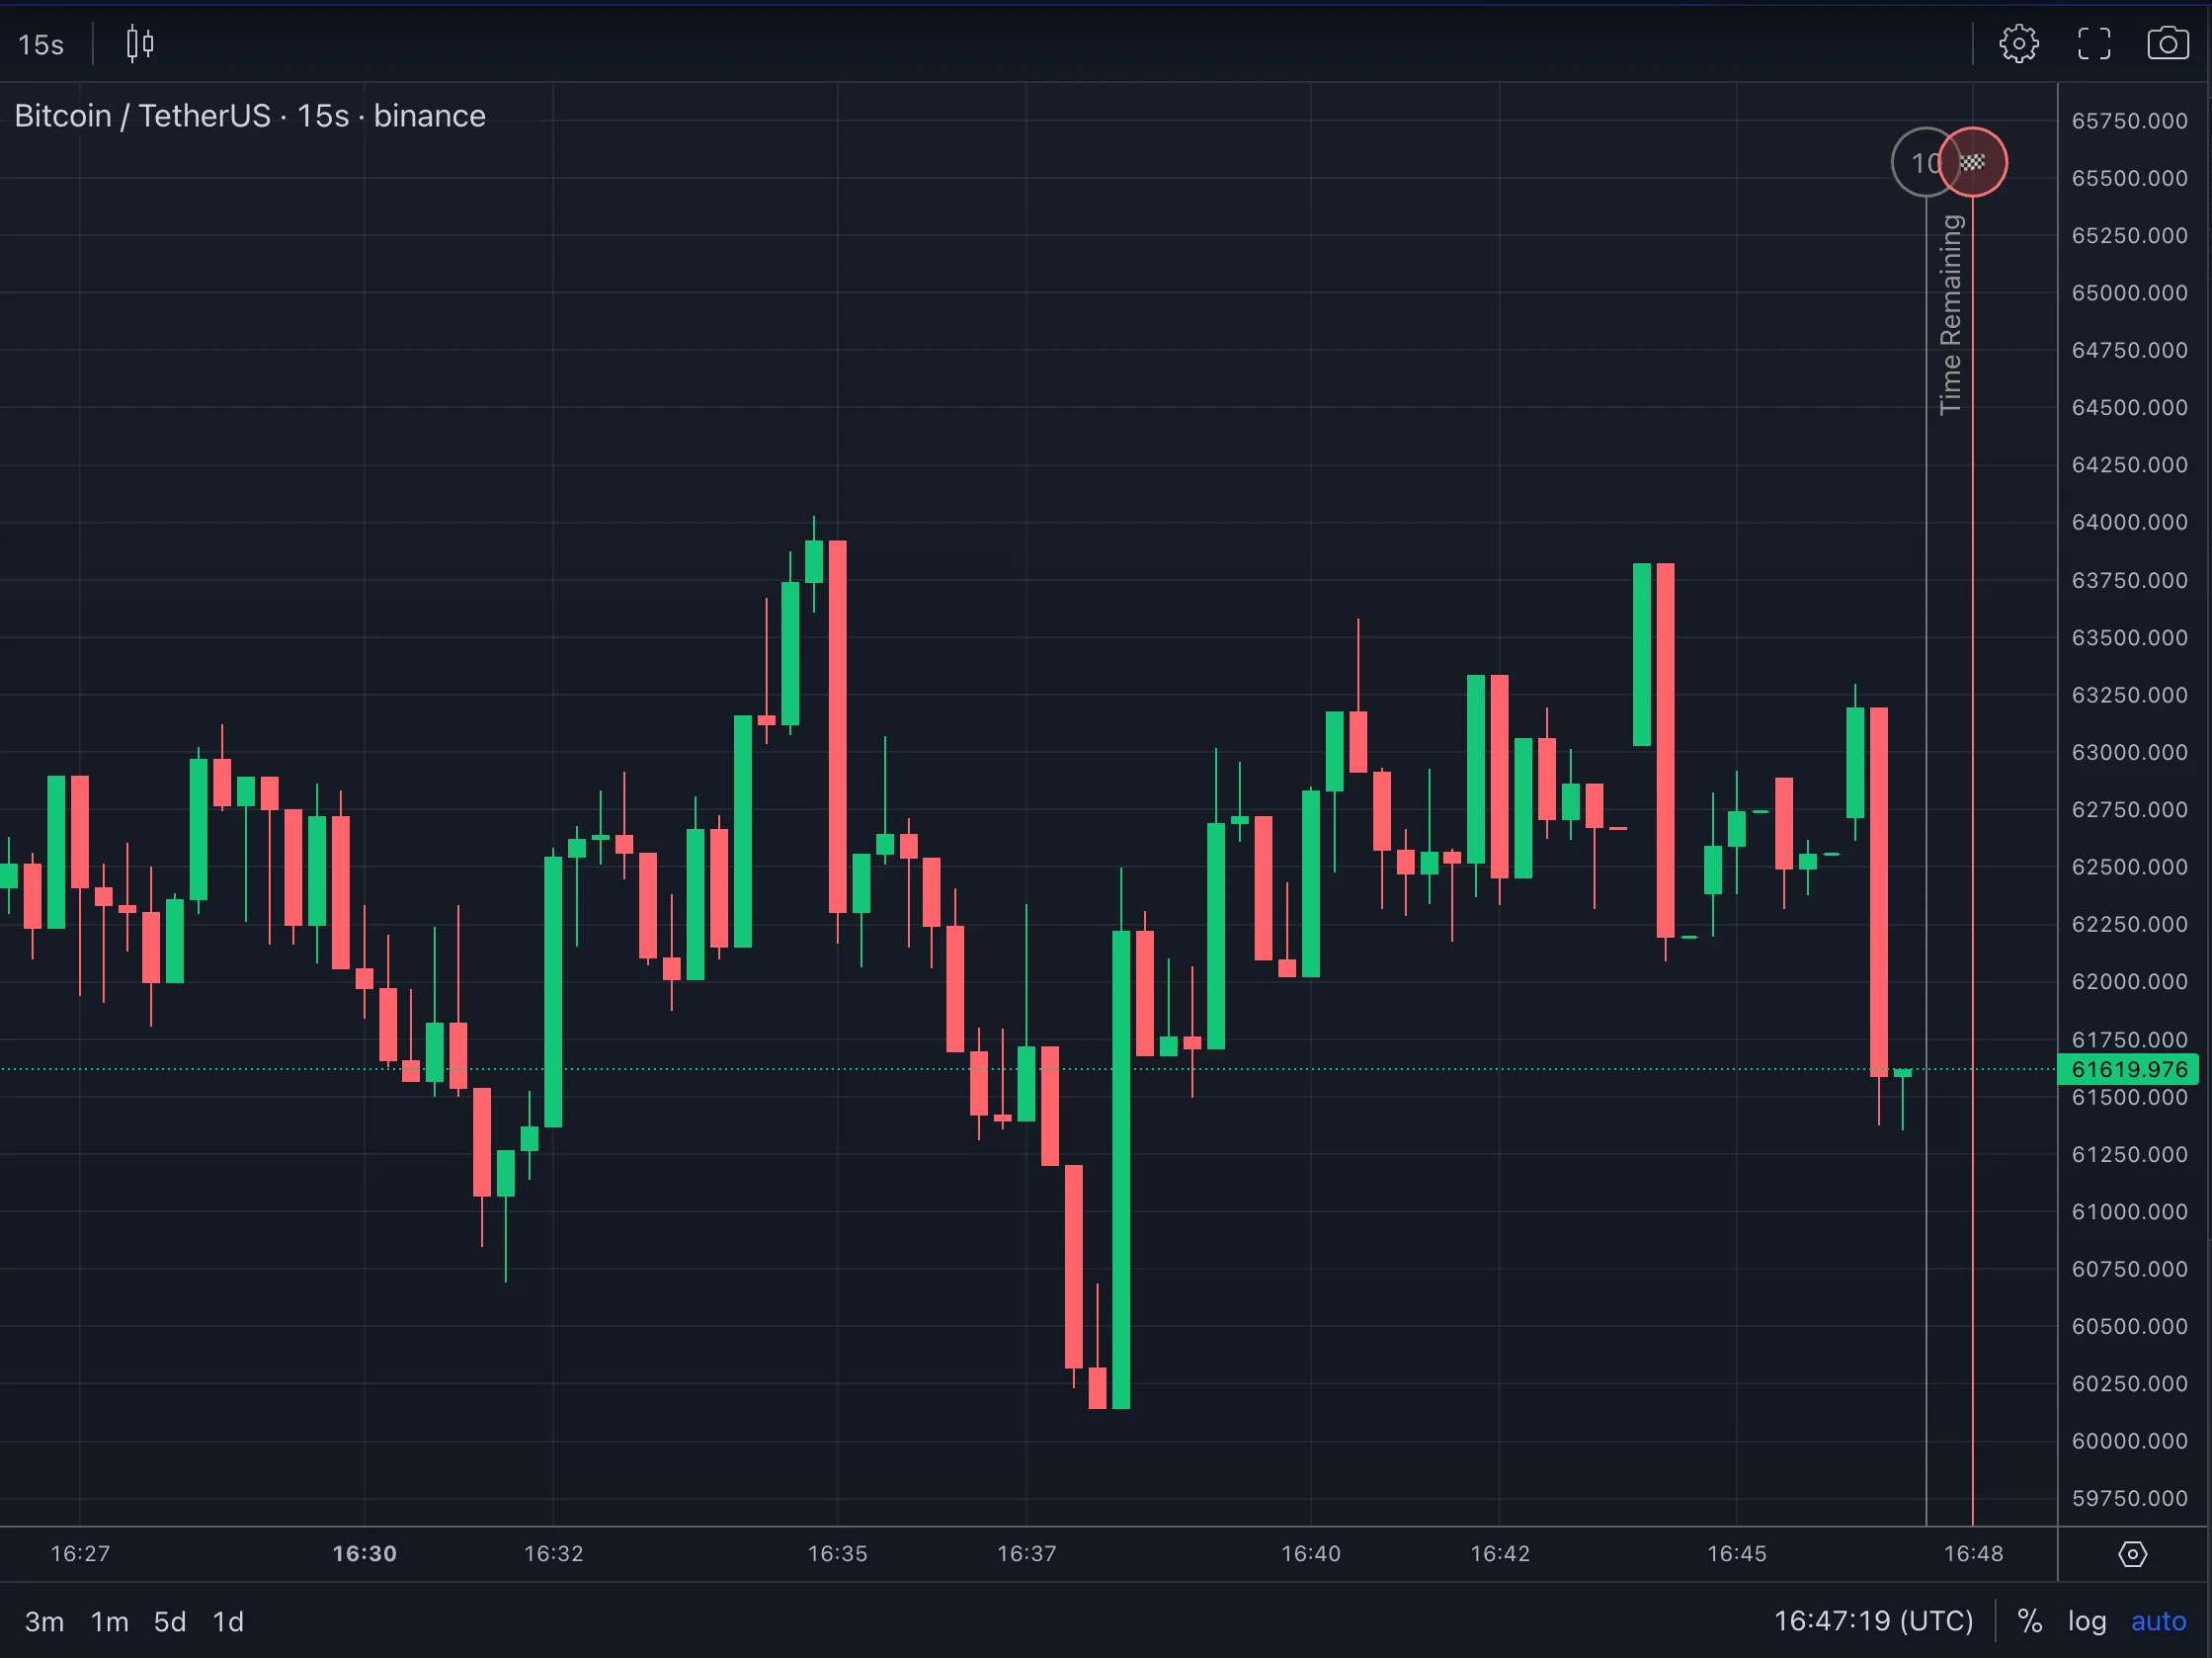
What questions can the chart help answer?
Section titled “What questions can the chart help answer?”Before placement, use the chart to review:
- Whether the price is rising, falling, or moving sideways.
- Whether recent volatility is strong or weak.
- Whether the price is near a support or resistance area.
- Whether the latest candle has a long wick or large body.
- Whether the price is reversing near the Invest line.
- Which session contains your investment and which Finish line applies.
The chart does not guarantee a result. It only helps you make a more structured decision.
Basic candle reading
Section titled “Basic candle reading”A candle normally contains:
| Component | Meaning |
|---|---|
| Open | Opening price of the candle. |
| High | Highest price reached during the candle. |
| Low | Lowest price reached during the candle. |
| Close | Closing price of the candle. |
| Body | Distance between Open and Close. |
| Wick | Price area reached but not maintained. |
In one-minute investment sessions, price may move very quickly. A single green or red candle is not enough to make a complete decision.
Reading a short-term trend
Section titled “Reading a short-term trend”Review the most recent candles:
| Observation | Cautious interpretation |
|---|---|
| Higher highs and higher lows | The short-term bias may be upward. |
| Lower highs and lower lows | The short-term bias may be downward. |
| Green and red candles alternate repeatedly | The market may be noisy. |
| Long wicks on both sides | Price is being pushed in both directions and risk is higher. |
| Price remains in a narrow range | There may be no clear direction. |
Support and resistance areas
Section titled “Support and resistance areas”Support is an area where price has previously been pushed upward several times. Resistance is an area where price has previously been pushed downward several times.
In short sessions:
- If price is near support and begins to rebound, some users may consider a Bullish scenario.
- If price is near resistance and is rejected downward, some users may consider a Bearish scenario.
- If price breaks strongly through an important area, wait for confirmation instead of reacting immediately.
These are analytical examples, not investment recommendations.
Reading volatility speed
Section titled “Reading volatility speed”In one-minute sessions, speed matters:
- The faster the price moves, the greater the risk of reacting too late.
- Sharp movement near the Invest line can cause emotional decisions.
- Do not use Real mode if the chart is lagging or the network is unstable.
- If candles become unusually large in a short period, consider reducing the Investment Amount or skipping the session.
Combining the chart with the timeline
Section titled “Combining the chart with the timeline”Always read the chart together with the Invest line and Finish line:
- Plenty of time before the Invest line: continue observing.
- Near the Invest line: place only if the scenario is already clear.
- After the Invest line: move to the next session.
- Near the Finish line: monitor the result instead of trying to place in the old session.
Combining the chart with the Order Book
Section titled “Combining the chart with the Order Book”The chart shows how price is moving. The Order Book shows whether recent capital flow is leaning Bullish or Bearish.
| Chart | Order Book | Cautious interpretation |
|---|---|---|
| Price rising, Bullish dominant across several rows | Price and capital flow are aligned upward. | |
| Price rising, Bearish strongly dominant | Capital is leaning against the move; use caution. | |
| Price falling, Bearish dominant across several rows | Price and capital flow are aligned downward. | |
| Price sideways, dominance changes repeatedly | The market is noisy and no clear scenario is present. |
How not to read the chart
Section titled “How not to read the chart”Do not:
- Place an investment because of a single green or red candle.
- Place an investment only because the price just moved sharply.
- Place an investment to recover the previous result.
- Place an investment without checking the selected session.
- Place an investment when the chart or real-time data is not working.
- Use the full Account Balance because the result feels “certain.”