View Direct Investment History
The Investment History page records all Direct Investment activity completed on BrokerIG. Use it to review each investment decision, reconcile results after a session ends, and evaluate performance by day, week, month, year, or all time.
In Direct Investment, you choose the Market Pair, market direction, and Investment Amount. Each result is stored separately so that it can be reviewed later.
When should you use this page?
Section titled “When should you use this page?”Open Investment History when you want to:
- Check whether a recently settled investment was profitable.
- Review the Market Pair, such as BTC/USDT, ETH/USDT, or BNB/USDT.
- Review whether Bullish or Bearish was selected.
- Review the Invested Amount, Capital Gains, final result, and status.
- Evaluate performance during a selected period.
- Prepare information before contacting Support.
Difference from entrusted-investment history
Section titled “Difference from entrusted-investment history”This page records only Direct Investment activity that you placed yourself.
It is different from My Campaigns, which displays Entrusted Investment campaigns that you joined. In Entrusted Investment, you do not place each individual investment. You join a campaign and entrust capital to a Consultant for the campaign duration.
| Topic | Direct Investment | Entrusted Investment |
|---|---|---|
| Who selects the investment opportunity? | You select the pair and market direction. | The Consultant manages the campaign. |
| Where is the data shown? | Investment History | My Campaigns |
| Results are displayed by | Individual investment | Campaign |
| Main action | Review each investment and reconcile profit or loss | Monitor joined campaigns |
Performance Overview
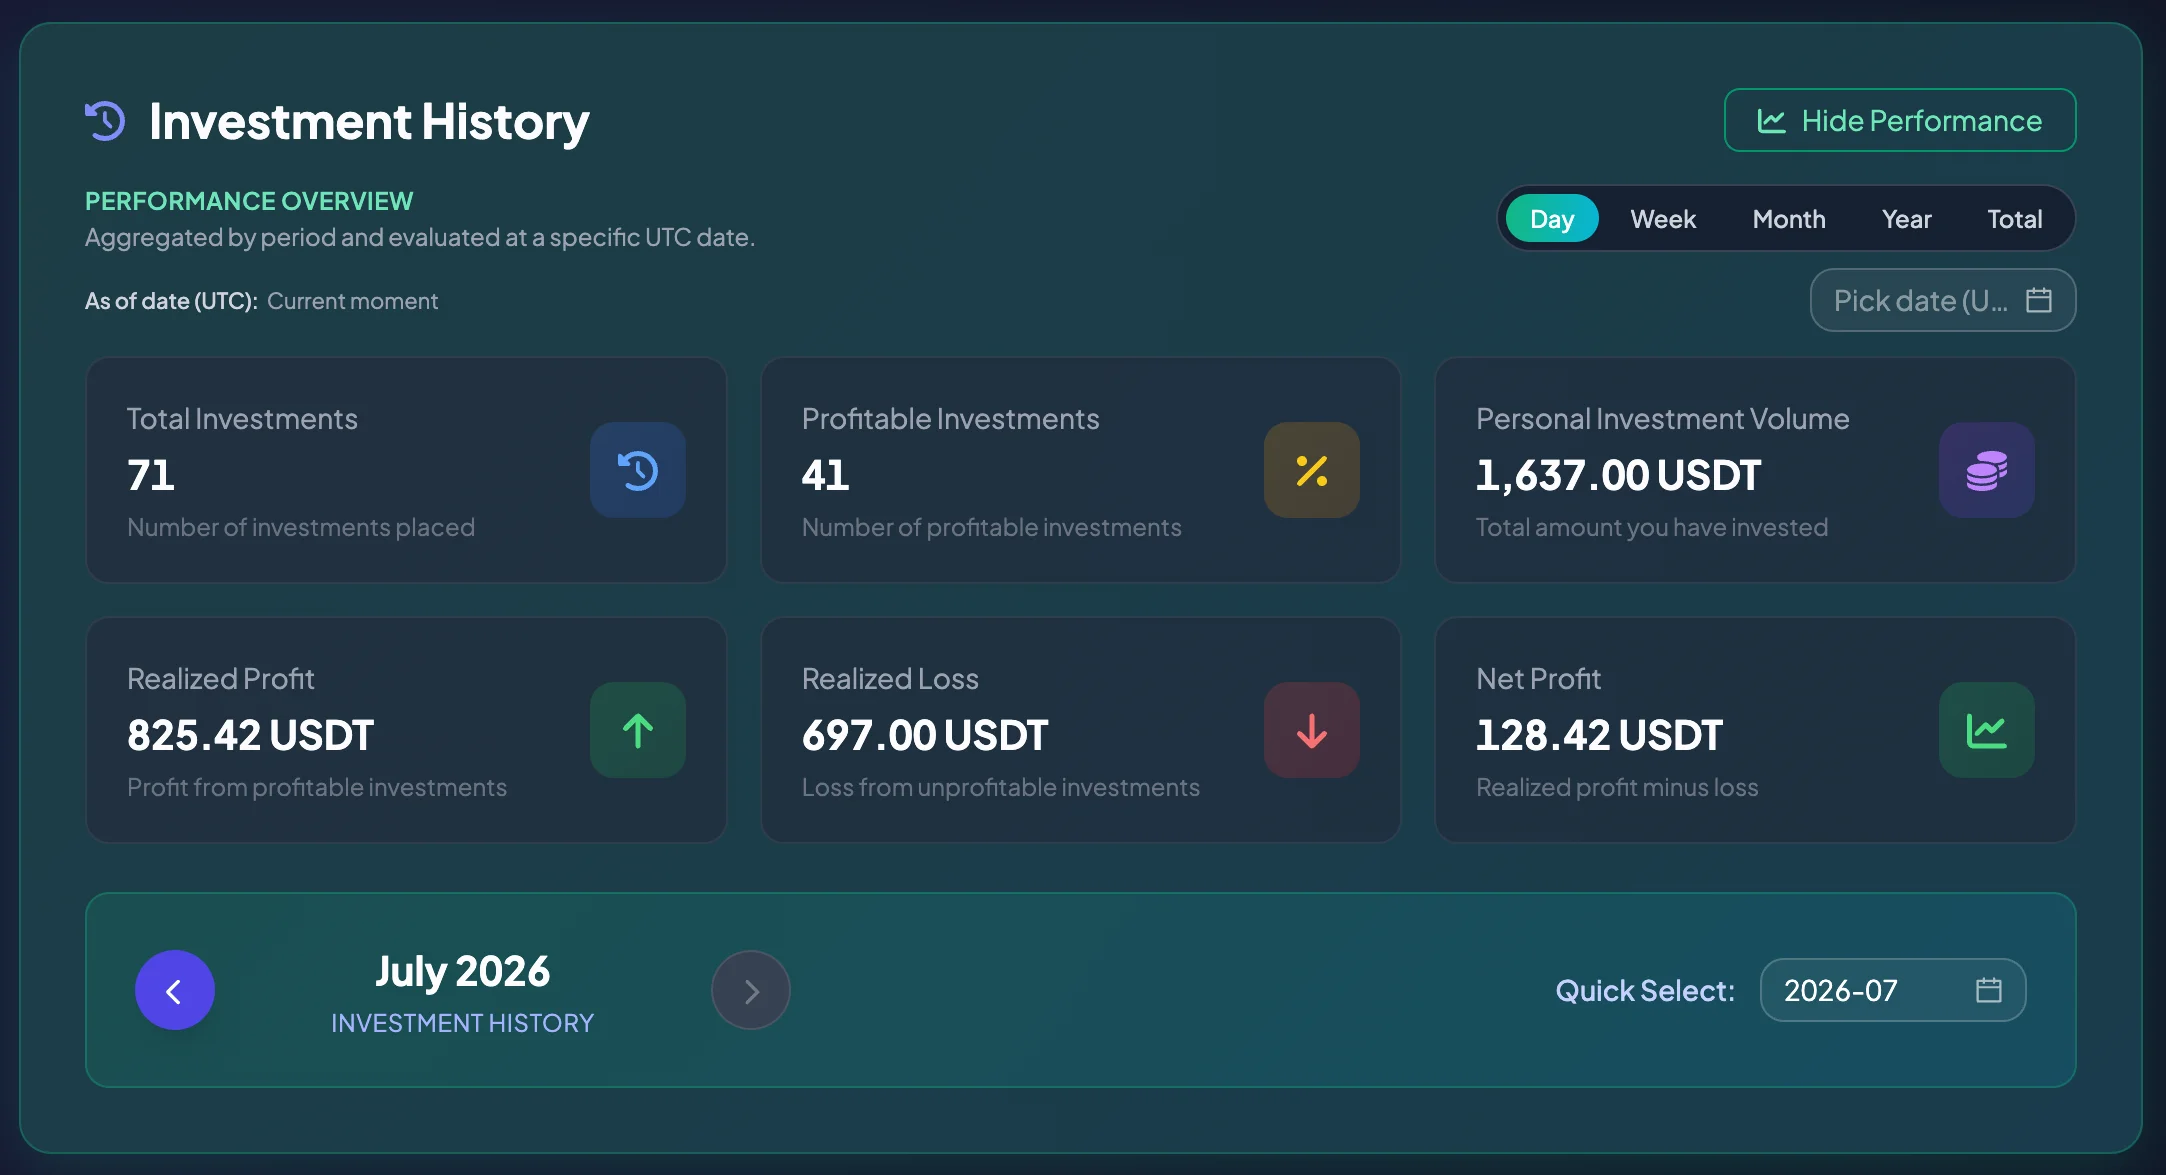
Section titled “Performance Overview”The Performance Overview at the top of the page summarizes Direct Investment results for the selected period.
You may switch between:
- Day
- Week
- Month
- Year
- Total
The system may calculate and display the period in UTC. When comparing it with your local time, account for the timezone difference.
Performance metrics
Section titled “Performance metrics”Total Investments
Section titled “Total Investments”Total Investments is the number of Direct Investment entries recorded in the selected period.
A higher number of investments does not necessarily mean better performance. Read it together with profitable results and Net Profit.
Profitable Investments
Section titled “Profitable Investments”Profitable Investments is the number of investments with a positive result after settlement.
Compare it with Total Investments to understand the actual proportion of profitable results.
Personal Investment Volume
Section titled “Personal Investment Volume”Personal Investment Volume is the total capital used for Direct Investment during the selected period.
For example, ten investments of 10 USDT each produce a Personal Investment Volume of 100 USDT. This is not profit; it is the total amount of capital used.
Recorded Capital Gains
Section titled “Recorded Capital Gains”Recorded Capital Gains is the total positive gain from profitable investments.
Read this metric together with Recorded Capital Losses to understand the net result.
Recorded Capital Losses
Section titled “Recorded Capital Losses”Recorded Capital Losses is the total negative result from non-profitable investments.
If this value increases quickly, review Market Pair selection, Investment Amount, and investment frequency.
Net Profit
Section titled “Net Profit”Net Profit is the remaining result after Recorded Capital Losses are deducted from Recorded Capital Gains.
- Positive Net Profit: the selected period is profitable overall.
- Zero Net Profit: gains and losses are balanced, or there is no data.
- Negative Net Profit: the selected period has a net loss.
Note: Historical performance is not a guarantee of future profit.
Filtering history by time
Section titled “Filtering history by time”The Investment History table lets you review records for specific periods. Depending on the interface, you may use quick period selectors or select a specific date or range.
When filtering:
- Select the intended period.
- Confirm whether the displayed time uses UTC or local time.
- Wait for the table to refresh.
- If no data appears, widen the date range or select Total.
Reading the Investment History table
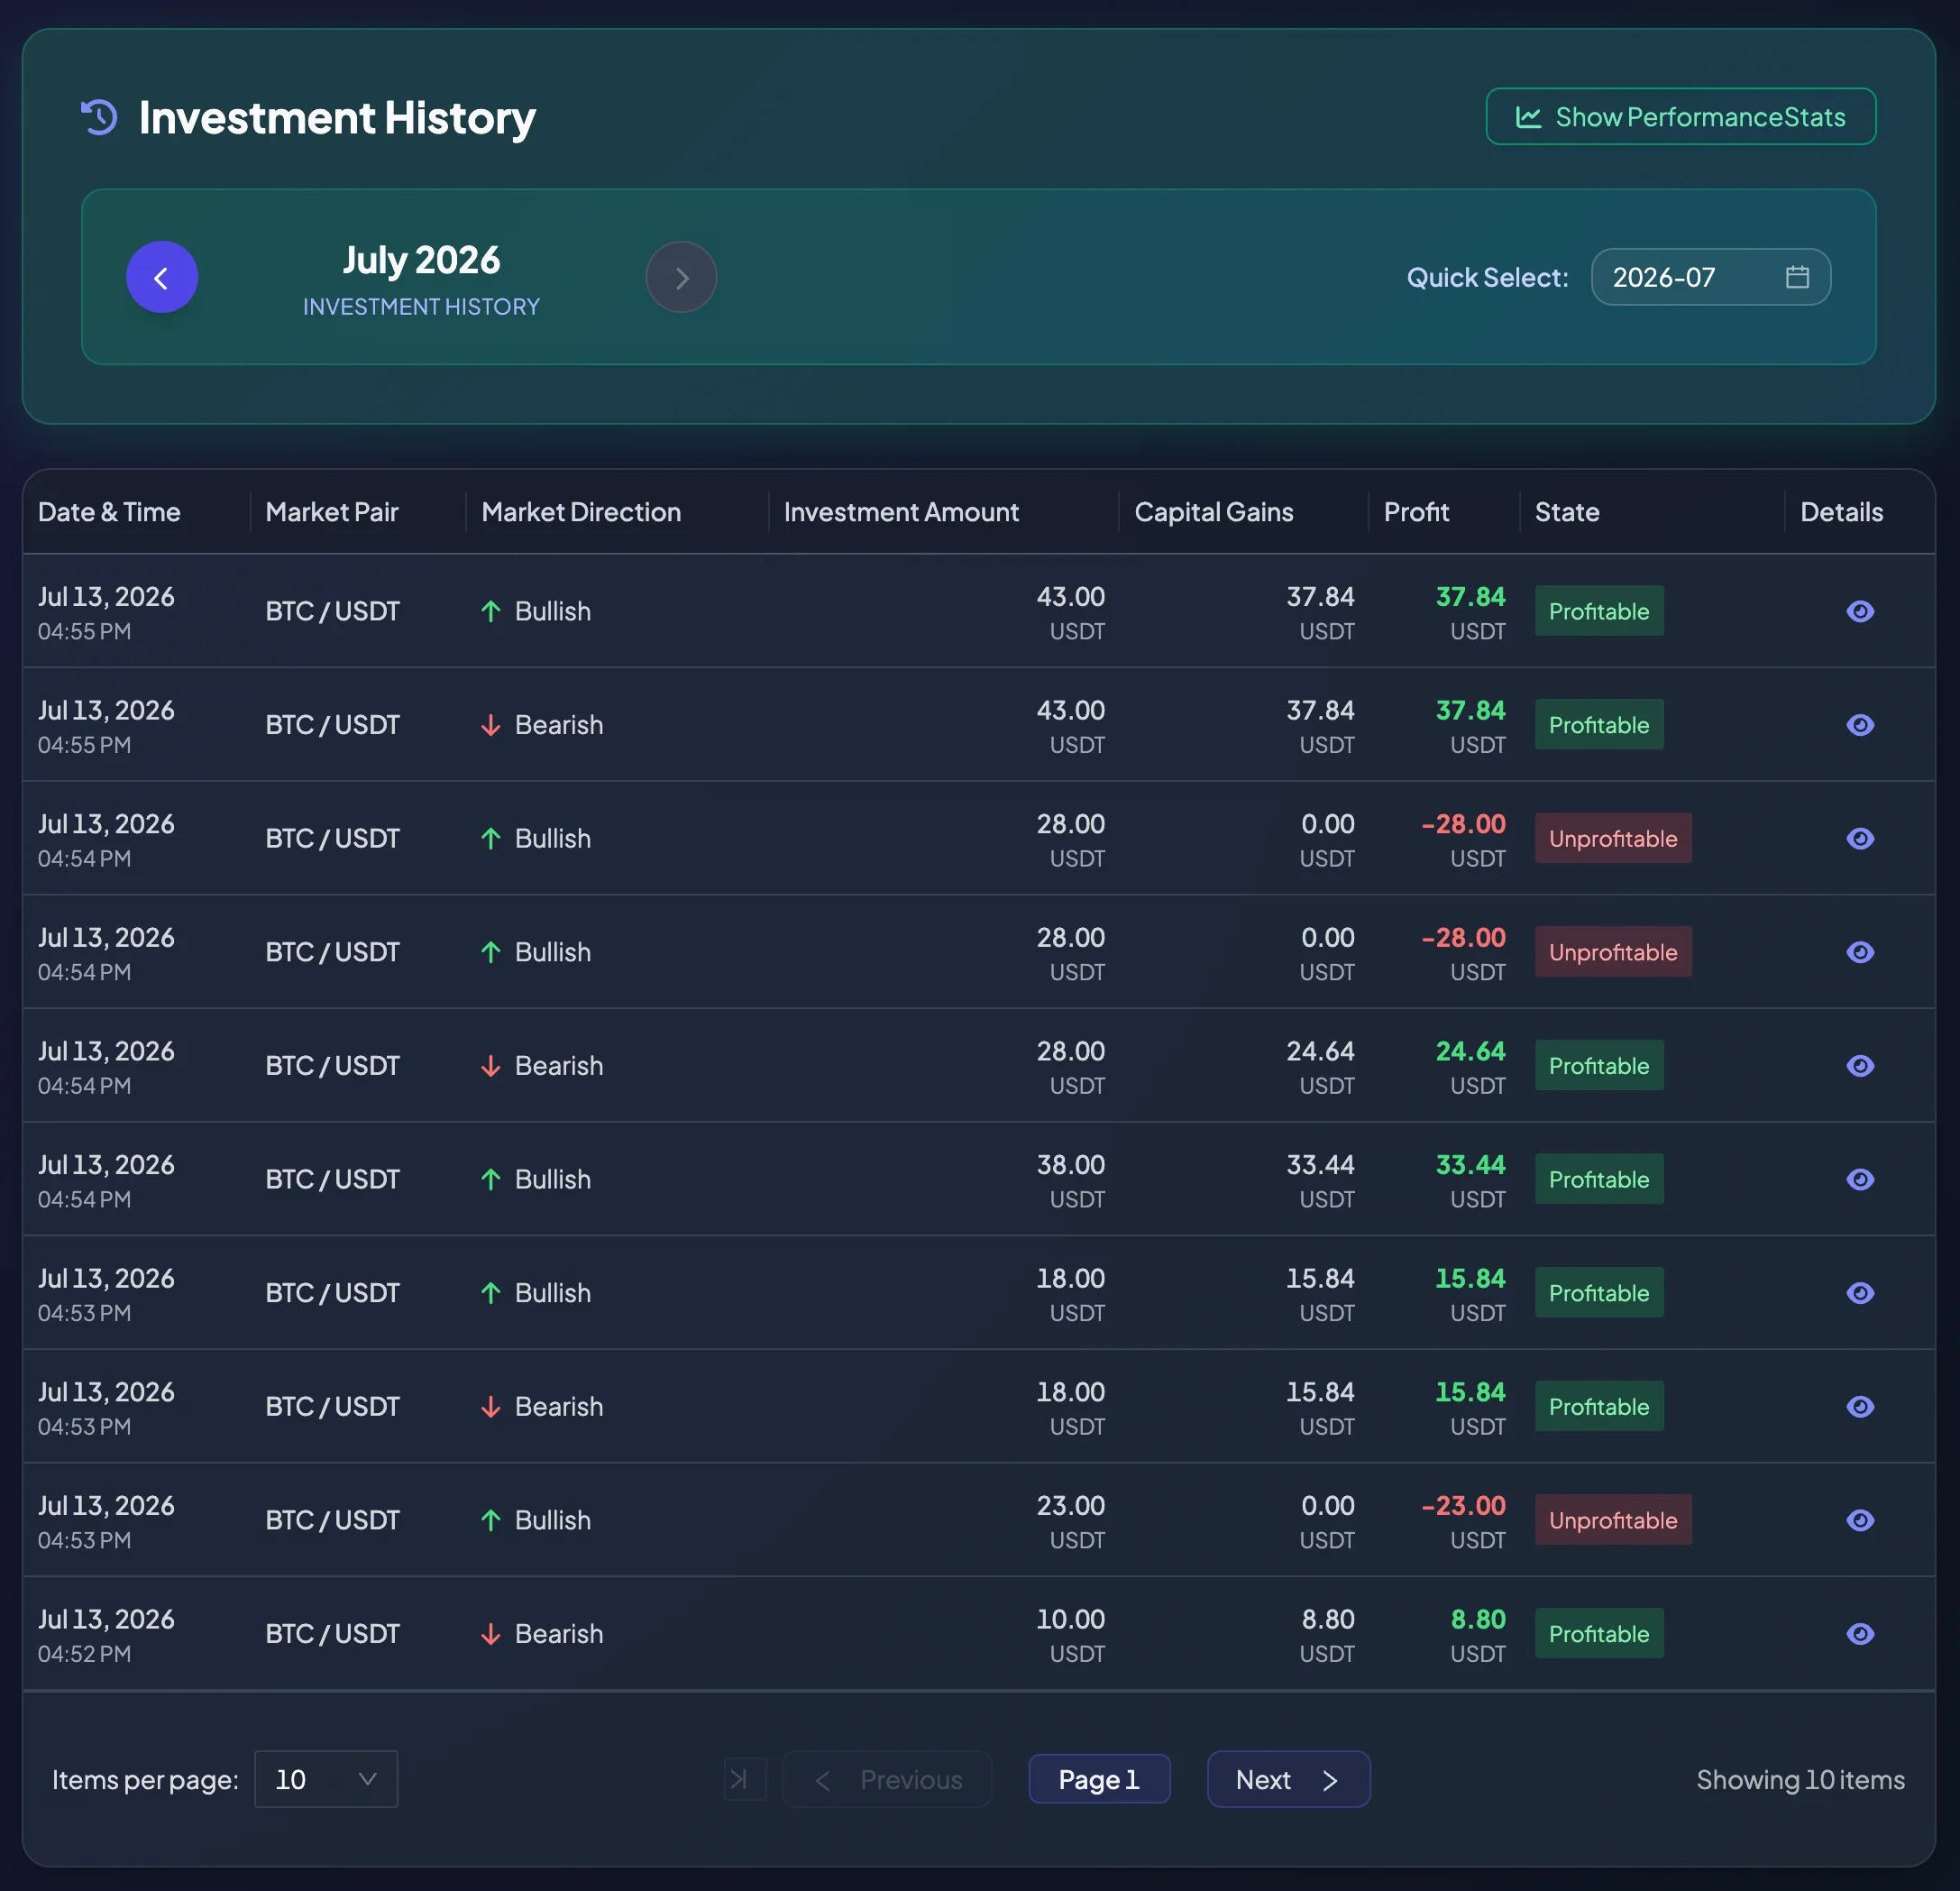
Section titled “Reading the Investment History table”Each row represents one Direct Investment.
| Column | Meaning |
|---|---|
| Date & Time | When the investment was recorded or settled. |
| Market Pair | The selected pair, such as ETH/USDT or BTC/USDT. |
| Market Direction | Bullish or Bearish. |
| Invested Amount | Capital used for that investment. |
| Capital Gains | Positive gain produced when the result is profitable. |
| Profit | Final result. A negative value indicates a loss. |
| Status | Current result, such as Profitable or Not Profitable. |
| Details | Opens the full investment record. |
Result statuses
Section titled “Result statuses”Profitable
Section titled “Profitable”Profitable means the investment closed with a positive result. Capital Gains and Profit normally display positive values.
For example, if you invest 10 USDT and Profit displays 8.10 USDT, the investment generated 8.10 USDT according to the platform calculation.
Not Profitable
Section titled “Not Profitable”Not Profitable means the investment did not achieve the intended result. Profit may display a negative amount, such as -10.00 USDT.
If several investments are not profitable in a row, reduce investment frequency, reduce the Investment Amount, or review the Market Pair selection strategy.
Viewing investment details
Section titled “Viewing investment details”To open a record:
- Open Investment History.
- Find the investment row.
- Select Details.
- Review the detail modal.
The detail modal may include:
- Market Pair.
- Investment date and time.
- Result status.
- Selected market direction.
- Investment Session.
- Invested Amount.
- Capital Gains.
- Final Profit.
Reconciling an investment with Support
Section titled “Reconciling an investment with Support”Prepare the following information:
- Market Pair.
- Investment date and time.
- Bullish or Bearish direction.
- Invested Amount.
- Result status.
- Screenshot of the detail modal.
This information helps Support identify the correct investment among records placed close together.
Important notes
Section titled “Important notes”- Direct Investment History reflects records stored by the system.
- Past results do not guarantee future results.
- If a recent record does not appear immediately, refresh the page or check again after a few minutes.
- If the time appears incorrect, verify the displayed timezone. Some screens use UTC for consistent reporting.
- Do not increase the Investment Amount only because several previous investments were profitable.