Detailed Analytics
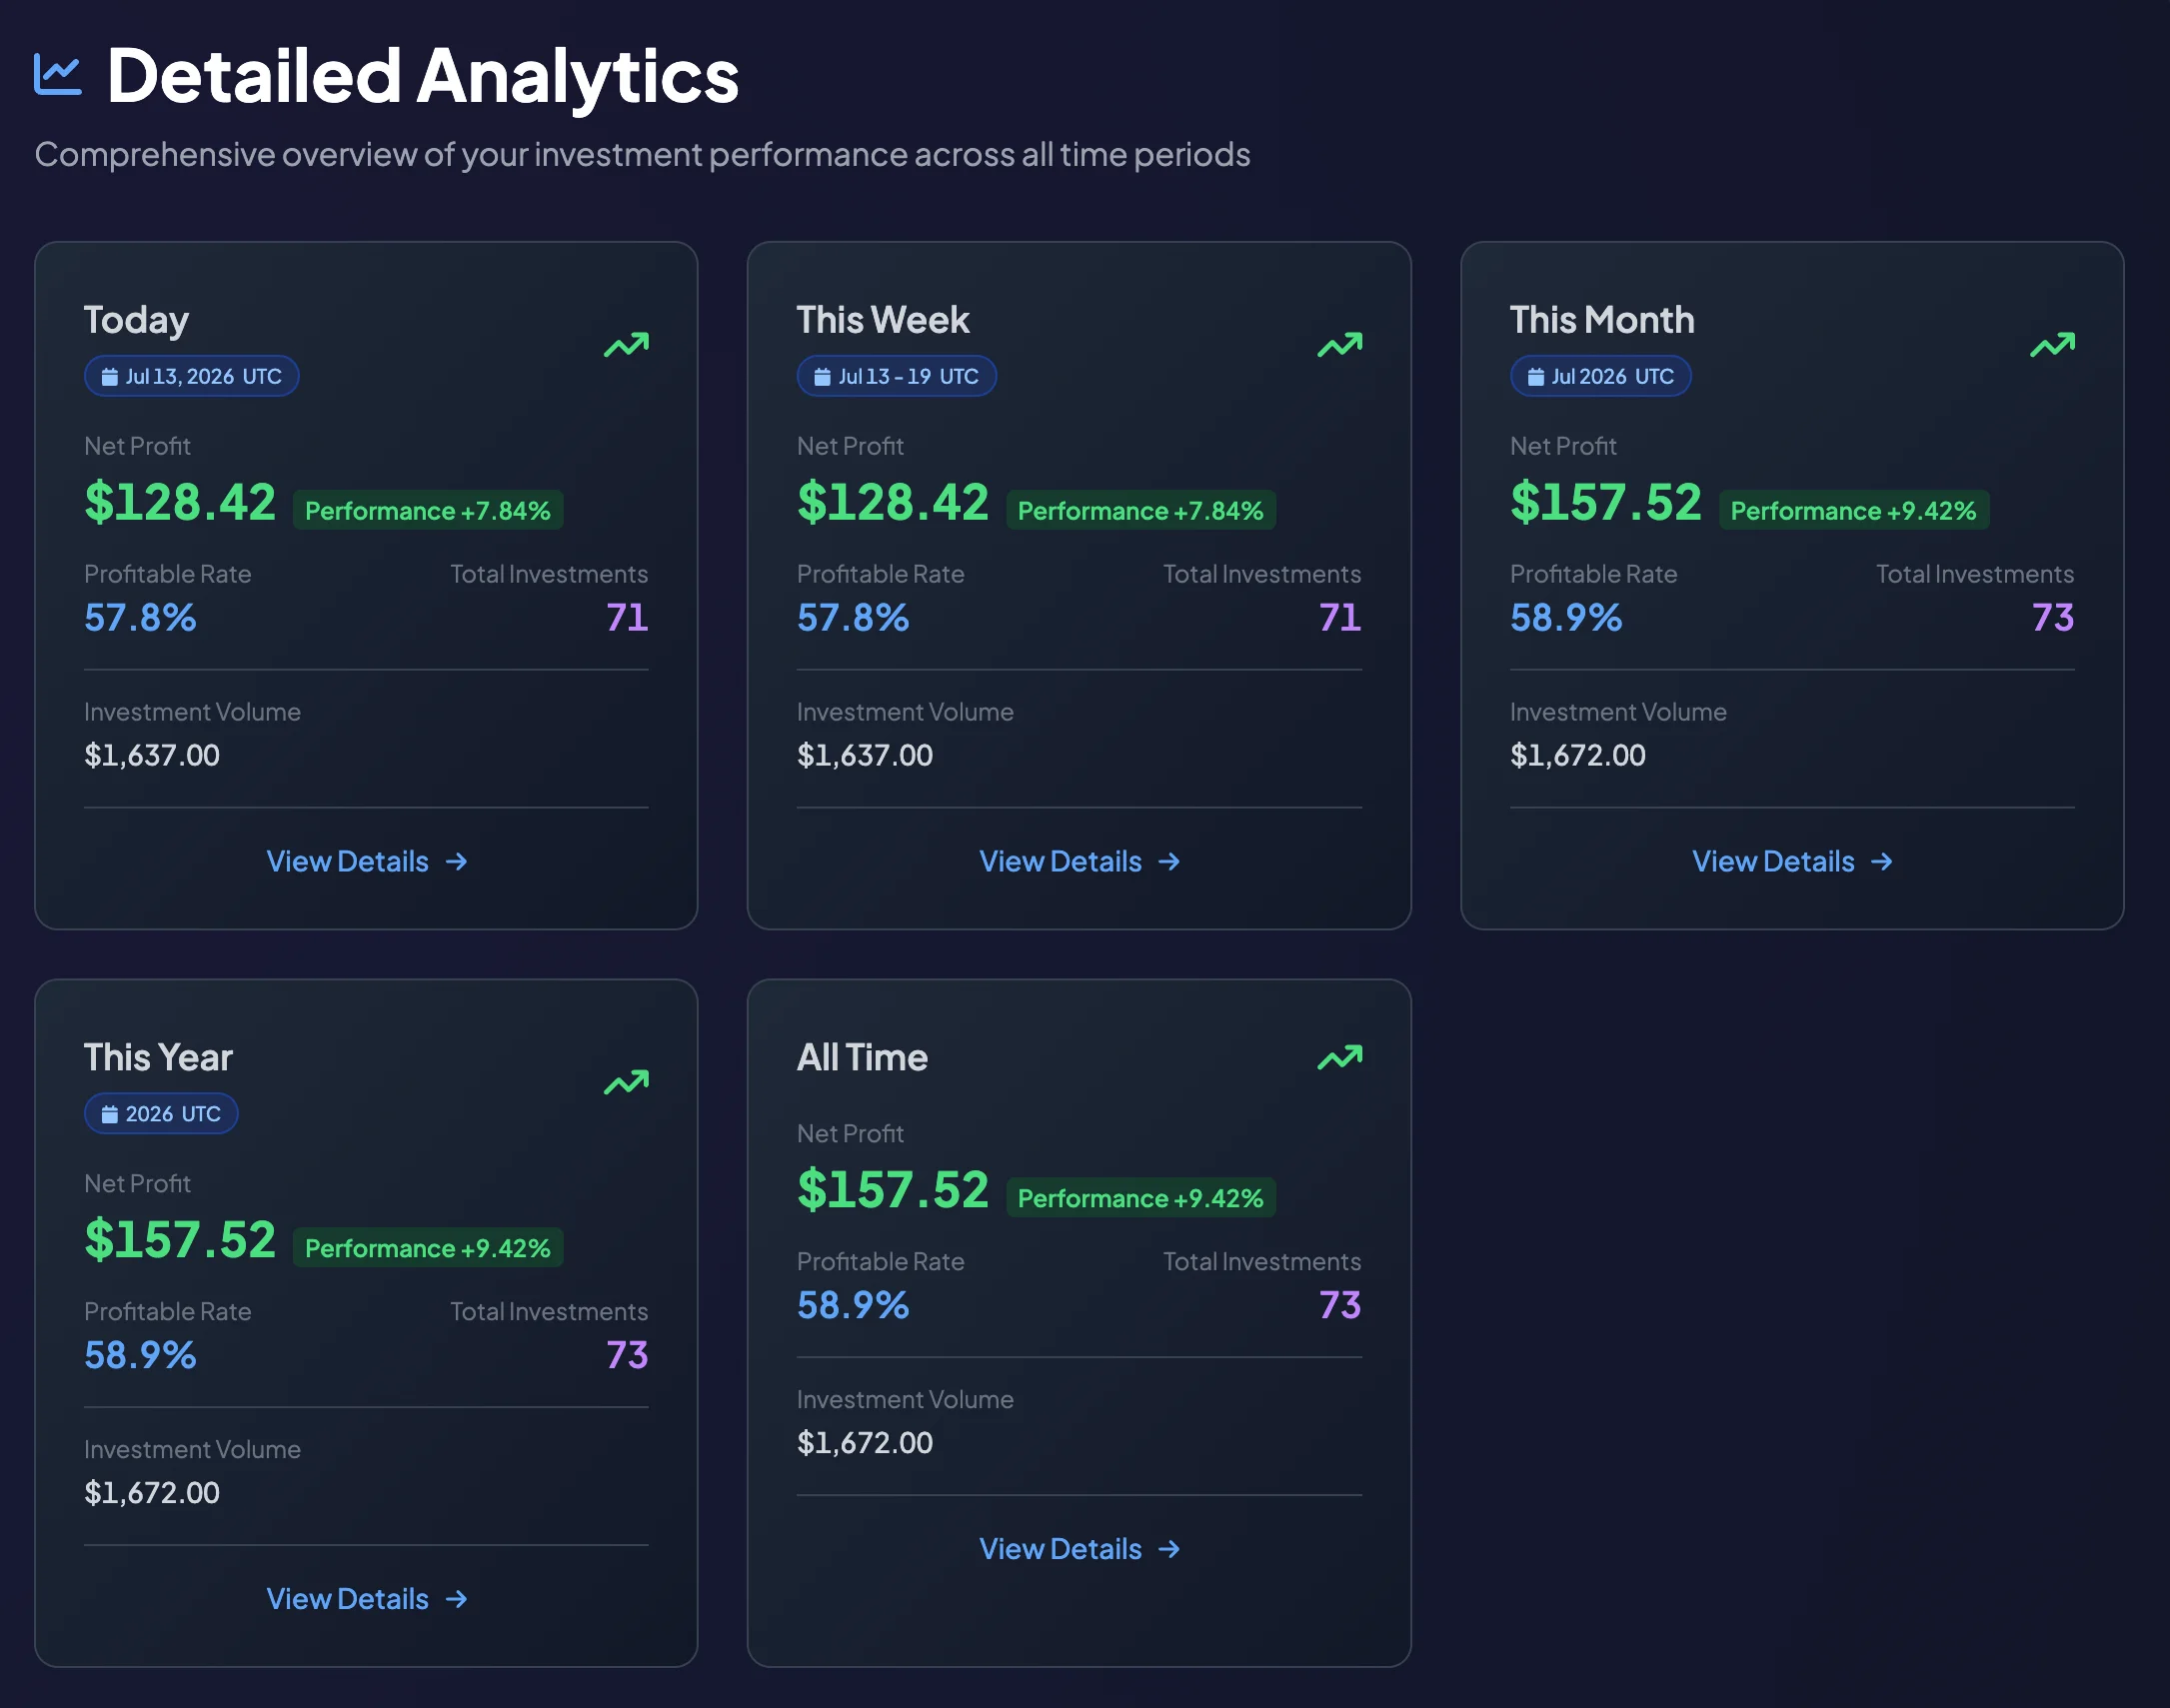
The Detailed Analytics page lets you review investment performance across several timeframes in one place. If the Dashboard is the quick-overview page, Detailed Analytics is where you compare periods and identify which results require deeper investigation.
The page provides reporting cards for:
- Today
- This Week
- This Month
- This Year
- All Time
Each card normally displays metrics such as Net Profit, Performance, Profitable Rate, Total Investments, and Investment Volume.
When should you use Detailed Analytics?
Section titled “When should you use Detailed Analytics?”Use this page when you want to answer questions such as:
- Is the account profitable or unprofitable today?
- Is This Week performing better than the previous week?
- Has Investment Volume increased too quickly this month?
- Is the Profitable Rate stable across timeframes?
- How different are Capital Gains and Capital Losses?
- Should you open a detailed report for a specific day or week?
Open Detailed Analytics
Section titled “Open Detailed Analytics”- Sign in to your BrokerIG account.
- Open General in the left sidebar.
- Select Analytics.
The page displays timeframe cards. A period may contain zero values when there was no investment activity or no available data for that range.
Read the timeframe cards
Section titled “Read the timeframe cards”Each card represents a reporting period and normally includes the period name, date range, UTC timezone, and primary metrics.
Today displays the selected day’s data. Because reporting is standardized in UTC, the UTC date may differ from your local date for investments placed near the local day boundary.
Use this card for a quick review of current-day performance.
This Week
Section titled “This Week”This Week displays data for the current week. It is useful for reviewing short-term activity, Total Investments, Investment Volume, and Profitable Rate during the most recent days.
This Month
Section titled “This Month”This Month helps you review performance during the current month. It is often the most useful period for evaluating investment discipline because it is long enough to reveal patterns while remaining recent enough for adjustments.
This Year
Section titled “This Year”This Year is suitable for monitoring longer-term performance. If monthly Net Profit changes significantly, review the yearly period to understand the overall direction.
All Time
Section titled “All Time”All Time contains cumulative data from the entire available account history. It helps assess the overall result, but it should not replace period-by-period analysis.
Metrics displayed on each card
Section titled “Metrics displayed on each card”Net Profit
Section titled “Net Profit”Net Profit is the primary result for the period. It is the remaining gain after Capital Losses are deducted from Capital Gains.
- Positive: the period has a net gain.
- Negative: the period has a net loss.
- Zero: there may be no data, no activity, or gains and losses are balanced.
Performance
Section titled “Performance”Performance compares Net Profit with Personal Investment Volume for the selected period.
For example, two periods may both have 100 USDT in Net Profit, but the period that used less capital may show better Performance.
Profitable Rate
Section titled “Profitable Rate”Profitable Rate is the percentage of profitable investments out of Total Investments.
Do not evaluate this metric alone. Read it together with Net Profit and Investment Volume. A high Profitable Rate can still accompany a net loss when losing investments are significantly larger.
Total Investments
Section titled “Total Investments”Total Investments is the number of investments recorded during the period.
If the count rises quickly but Net Profit does not improve, review investment frequency, Investment Amount, and entry timing.
Investment Volume
Section titled “Investment Volume”Investment Volume is the total capital used for investments during the period.
If Investment Volume increases quickly while the Profitable Rate falls, consider reducing the Investment Amount or reviewing how opportunities are selected.
Open a detailed report from a timeframe
Section titled “Open a detailed report from a timeframe”Each timeframe card includes View Details. Select it to open a deeper report for the corresponding period.
Examples:
- Select View Details under Today for a daily report.
- Select View Details under This Week for a weekly report.
- Select View Details under This Month, This Year, or All Time for the corresponding report when supported.
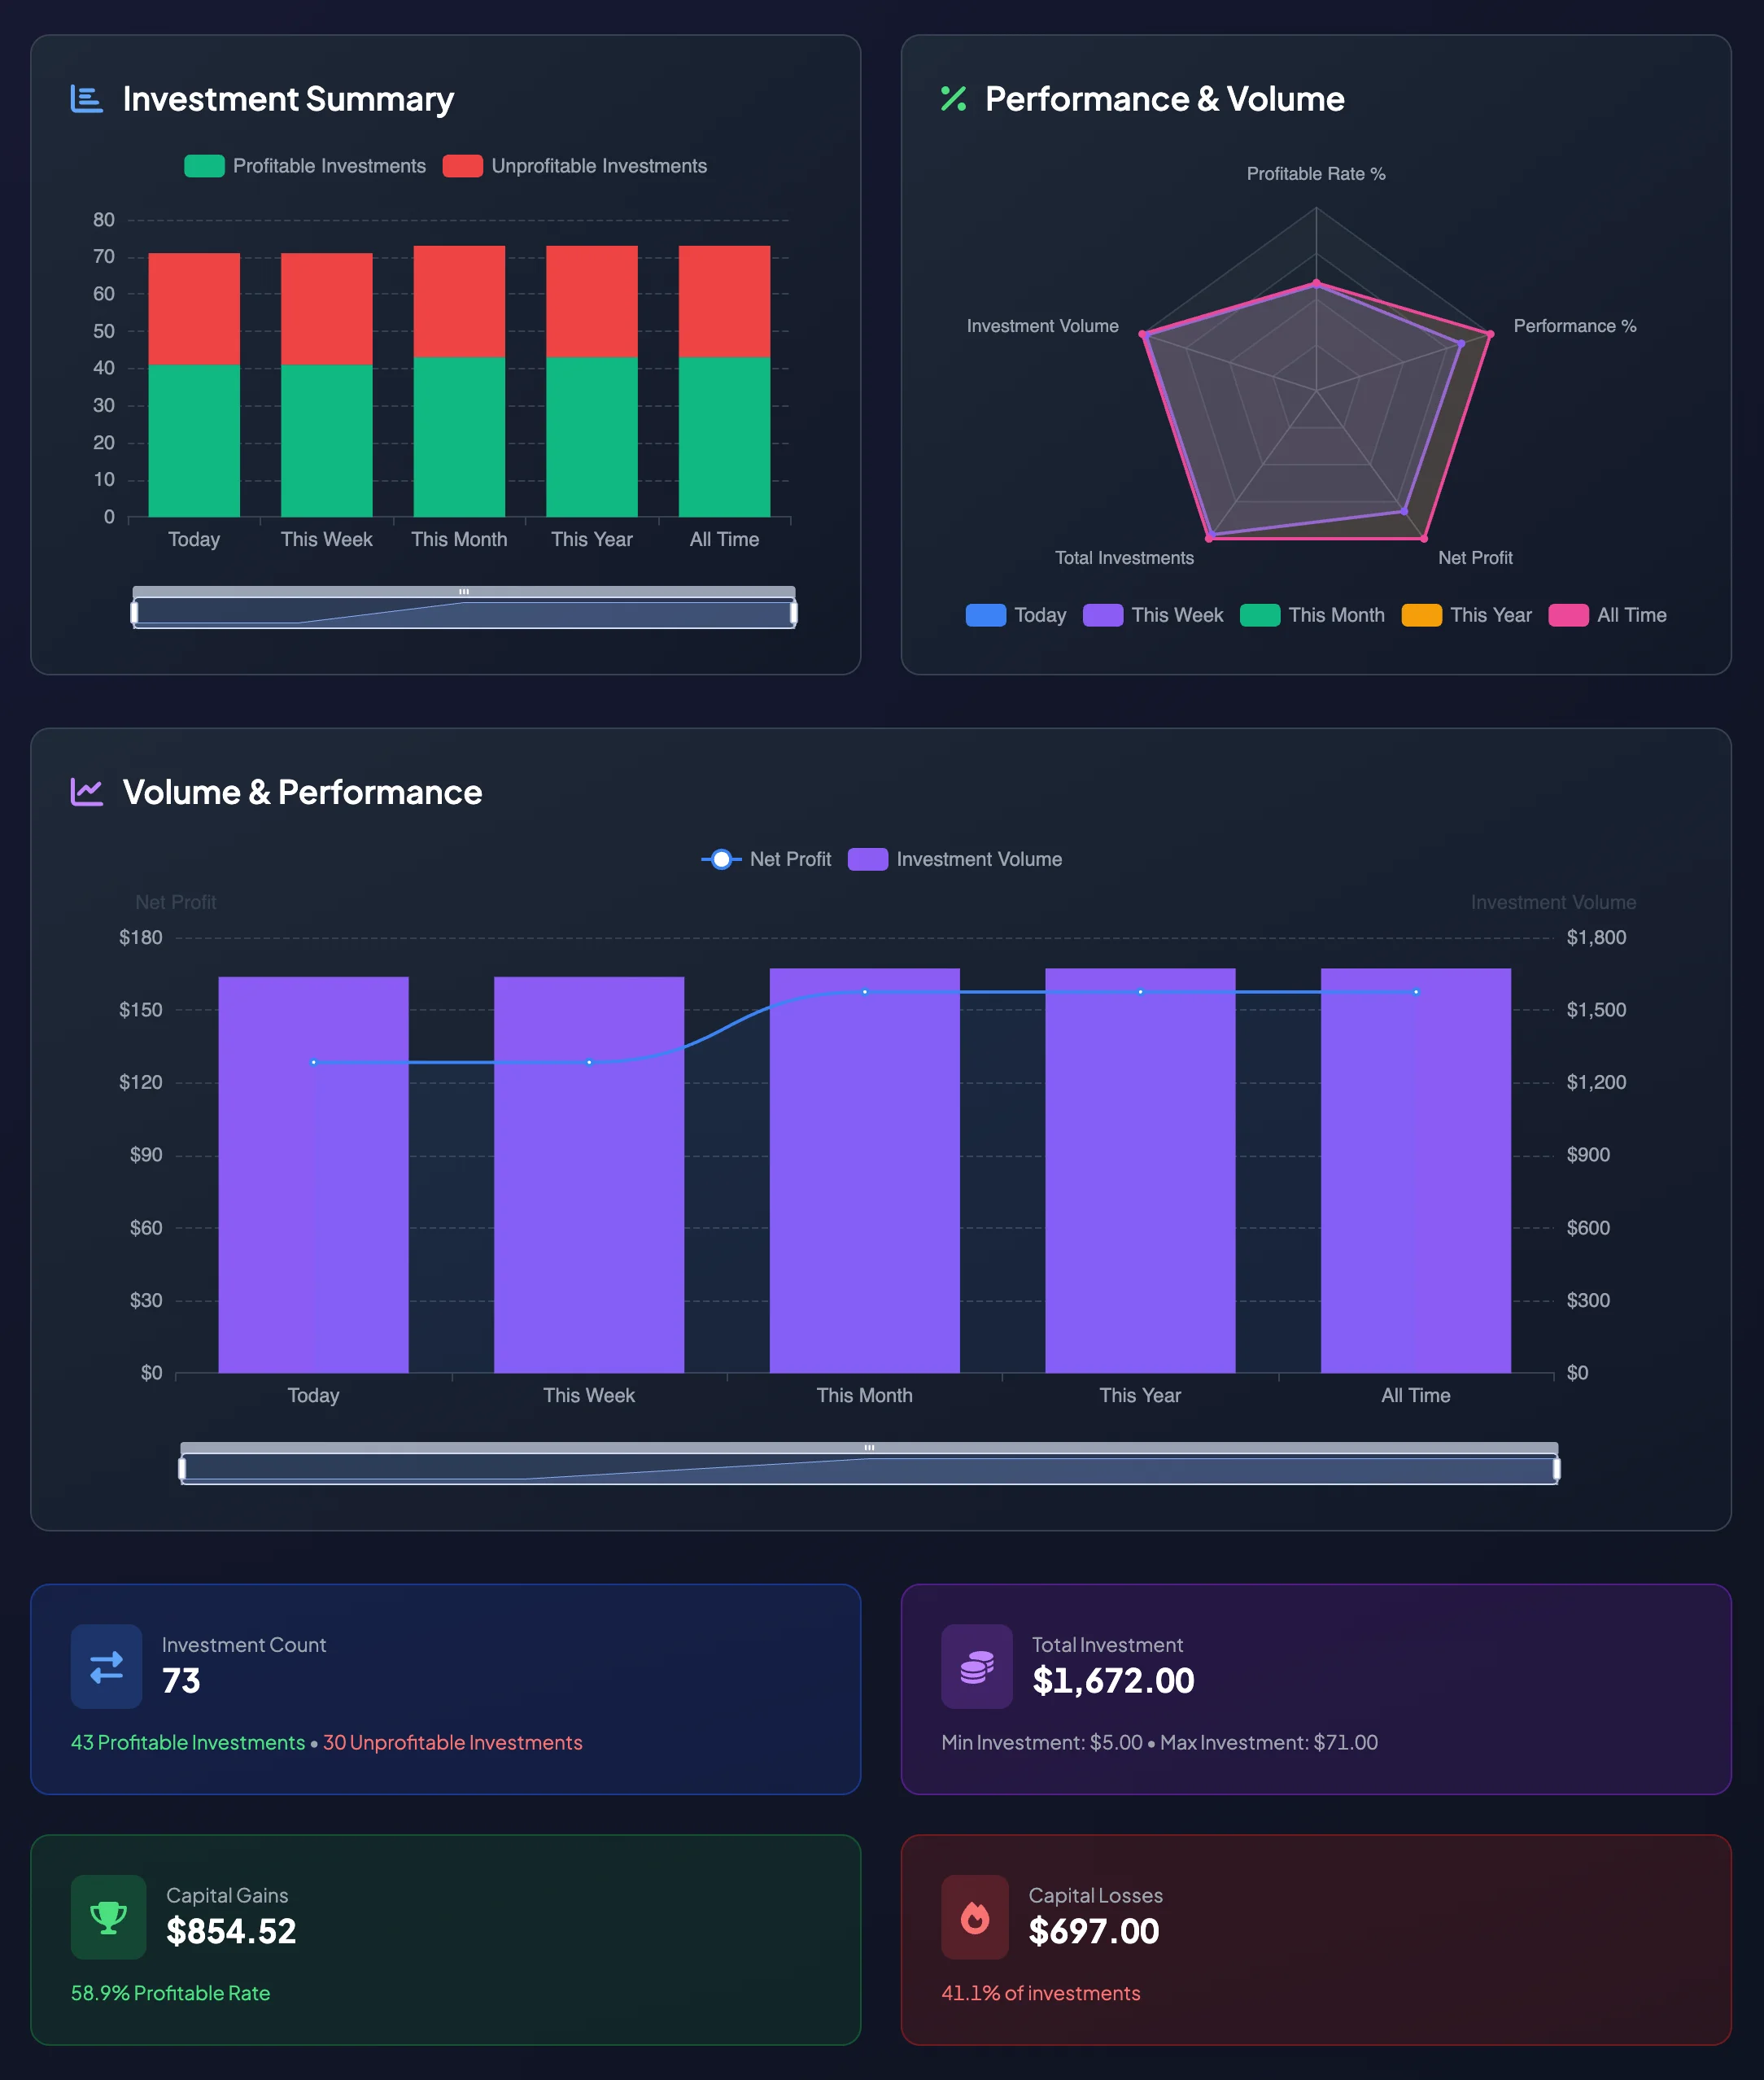
Read Investment Summary
Section titled “Read Investment Summary”Below the timeframe cards, Investment Summary provides a broader account-level overview.
It may include:
- Total Investments;
- Profitable Investments;
- Unprofitable Investments;
- Total Investment;
- Min Investment and Max Investment;
- Capital Gains;
- Capital Losses;
- Profitable Rate.
Use this section for a high-level assessment before opening a smaller reporting period.
Read Performance & Volume
Section titled “Read Performance & Volume”Performance & Volume compares investment results with the amount of capital used.
Review:
- periods with high Investment Volume but low Net Profit;
- periods with lower volume but stronger Performance;
- periods where the Profitable Rate drops unexpectedly;
- whether Capital Gains and Capital Losses are balanced or significantly different.
Read Timeframe Comparison
Section titled “Read Timeframe Comparison”Timeframe Comparison lists the main periods and their Net Profit. Use it to identify the period that requires deeper review.
- Find a period with negative Net Profit or an unusual change.
- Select View Details.
- Review the comparison table, trend charts, and History on the details page.
Quick period-analysis process
Section titled “Quick period-analysis process”Review a period in this order:
- Net Profit: Is the period profitable or unprofitable?
- Investment Volume: How much capital was used?
- Performance: Is Net Profit reasonable relative to the volume?
- Profitable Rate: How many investments achieved a profitable result?
- Total Investments: Is the investment count unusually low or high?
- View Details: Review History when the metrics appear unusual.
UTC reporting notes
Section titled “UTC reporting notes”Dates and ranges on Detailed Analytics are displayed in UTC.
If an investment appears under a different date than expected, check its UTC timestamp before concluding that the data is incorrect.