Dashboard
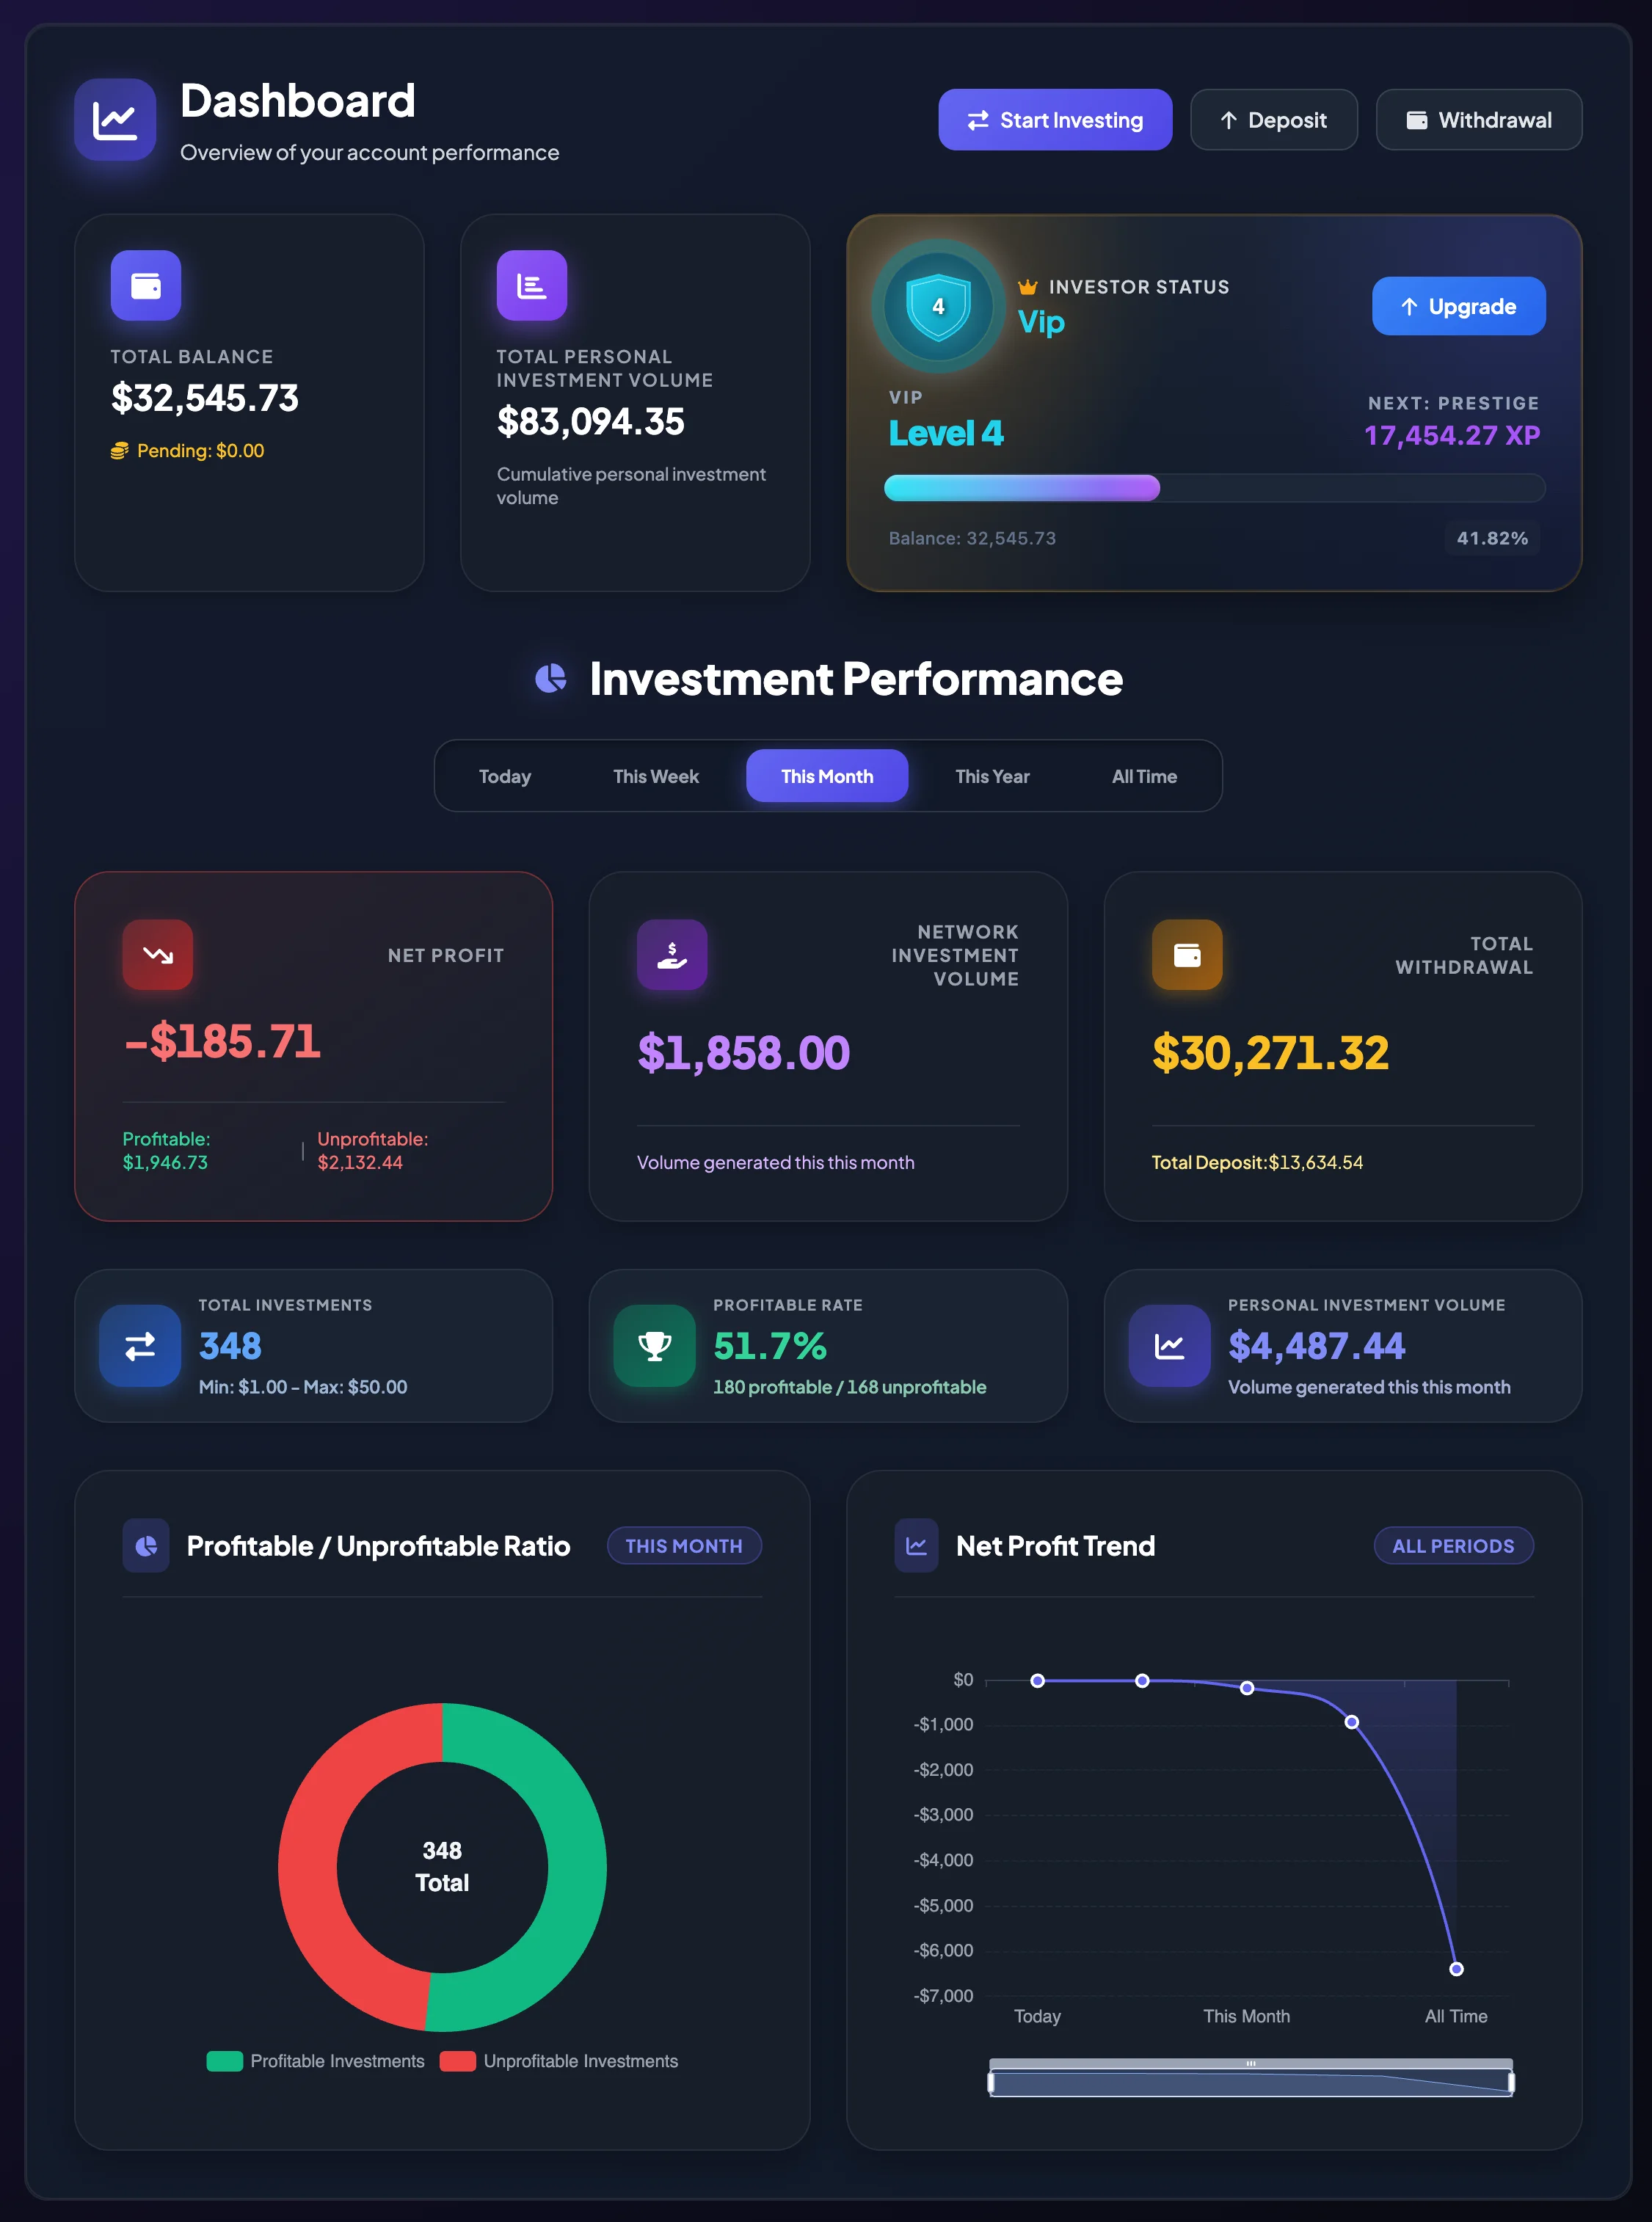
The Dashboard gives you a quick view of your account immediately after you sign in to BrokerIG. It is the first page to check before depositing, withdrawing, or starting a new investment.
From this page, you can review:
- the current Total Balance;
- funds or value that are Pending;
- cumulative Total Personal Investment Volume;
- the Current Level of the account;
- investment performance for Today, This Week, This Month, This Year, or All Time;
- the ratio of profitable and unprofitable investments;
- the Net Profit Trend across reporting periods.
When should you use the Dashboard?
Section titled “When should you use the Dashboard?”Open the Dashboard when:
- you have just signed in and want to check the current balance;
- you have just deposited or withdrawn funds and want to review the balance status;
- you want to review investment performance for the current month;
- you want to check Total Investments, Profitable Rate, and Personal Investment Volume;
- you want to decide whether to continue investing, reduce the Investment Amount, or open a more detailed report.
Open the Dashboard
Section titled “Open the Dashboard”- Sign in to your BrokerIG account.
- Find General in the left sidebar.
- Select Dashboard.
On a small screen, open the navigation menu first, then select Dashboard under General.
Quick actions at the top of the page
Section titled “Quick actions at the top of the page”The top of the page may include actions such as Start Investing, Deposit, and Withdrawal. These buttons open the relevant flow without requiring you to find it again in the sidebar.
Start Investing
Section titled “Start Investing”Select Start Investing when you have checked the balance and want to open the investment area. Before continuing, make sure you understand the investment product, intended Investment Amount, and possible risks.
Deposit
Section titled “Deposit”Select Deposit to add funds to your account. After depositing, check Total Balance and Pending to determine whether the funds are available or still being processed.
Withdrawal
Section titled “Withdrawal”Select Withdrawal to transfer funds out of the account. Before confirming, review the Available Balance, receiving information, selected network, and the currently applicable withdrawal conditions.
Read the Total Balance card
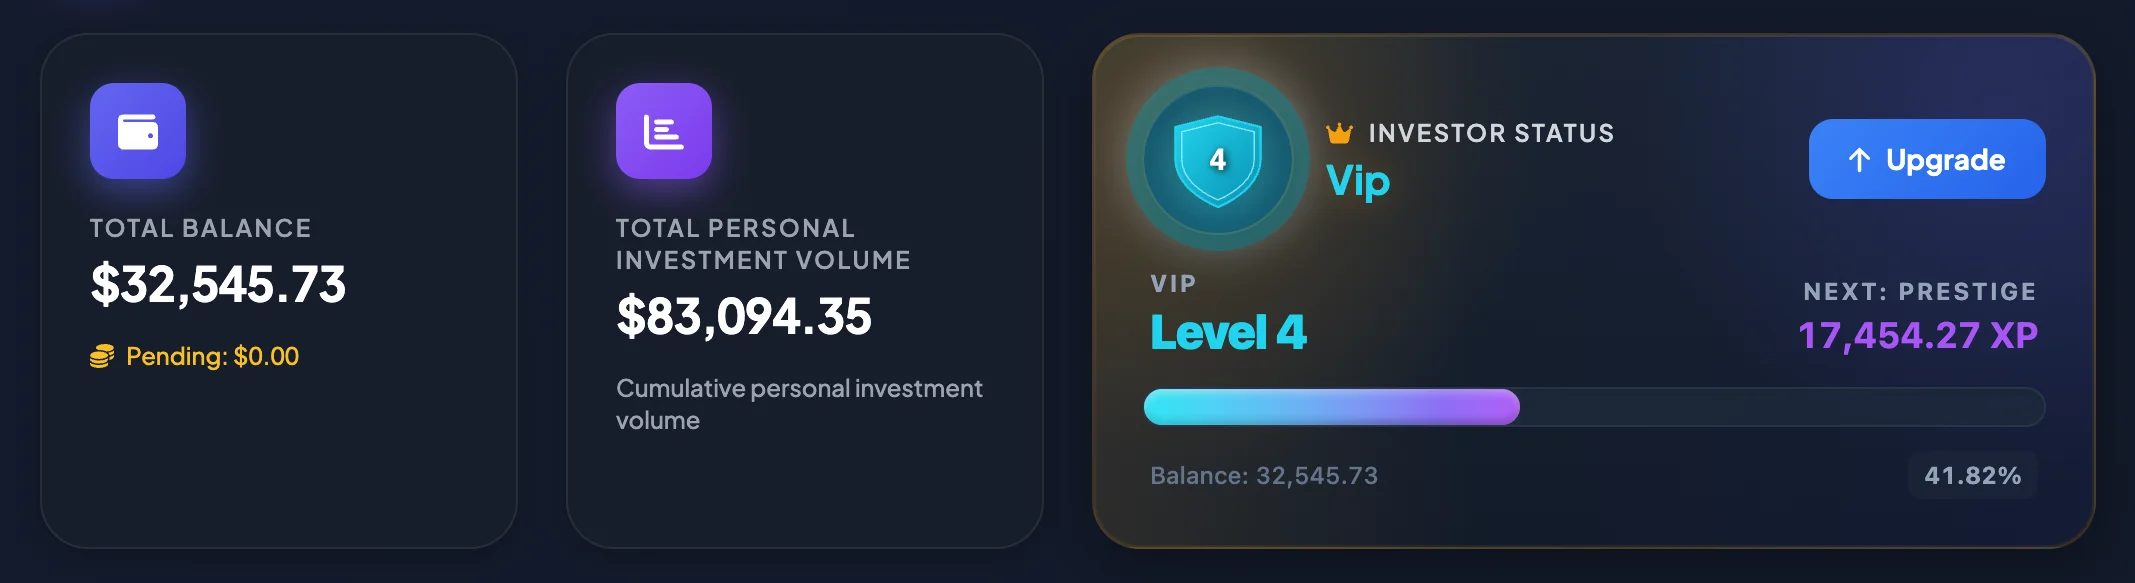
Section titled “Read the Total Balance card”The Total Balance card shows the value currently recorded in your account.
A Pending value may appear below it. Pending represents funds or value that are still being processed. For example, a deposit, withdrawal, or another financial operation may not be completed immediately.
Distinguish between:
- Total Balance: the total value displayed for the account;
- Pending: value that has not finished processing;
- Available Balance: depending on the system configuration, this may be lower than Total Balance when part of the funds is Pending or reserved.
If Total Balance does not update after a deposit or withdrawal, check the transaction history and processing status before contacting Support.
Read Total Personal Investment Volume
Section titled “Read Total Personal Investment Volume”Total Personal Investment Volume is the cumulative value of investments recorded for your account.
This metric is not profit. A high investment volume does not automatically mean high profit. To evaluate performance, also review Net Profit, Profitable Rate, and Investment Performance.
Read Investor Status
Section titled “Read Investor Status”The Investor Status area displays the Current Level and progress toward the Next Level. The level is linked to the Account Balance.
You may see:
- Current Level;
- Next Level;
- progress percentage;
- the amount still required to reach the Next Level;
- an Upgrade button, when available.
Review Investment Performance
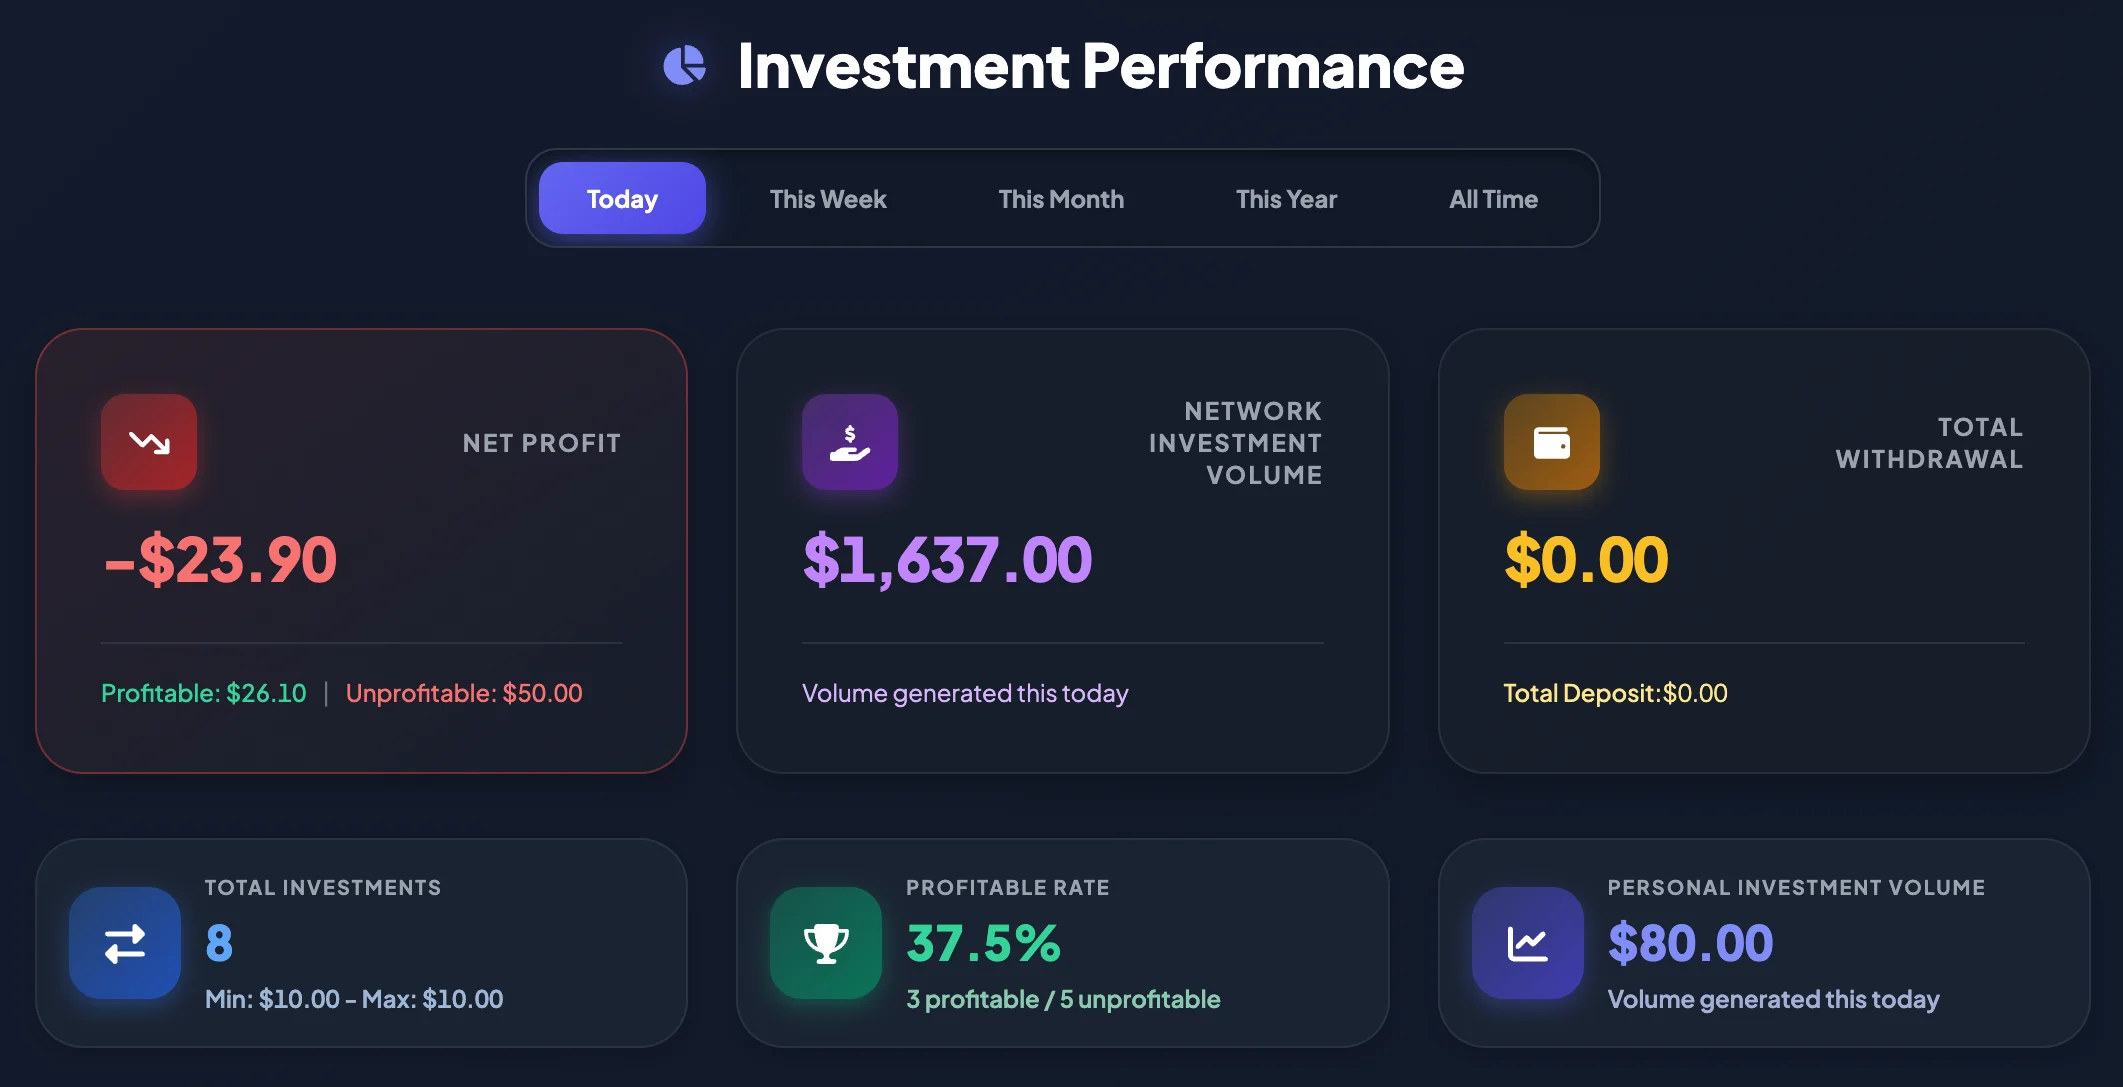
Section titled “Review Investment Performance”Investment Performance is the most important area of the Dashboard. You can switch between several timeframes:
- Today
- This Week
- This Month
- This Year
- All Time
When you select a timeframe, the metric cards below update for that period.
Investment Performance metrics
Section titled “Investment Performance metrics”Net Profit
Section titled “Net Profit”Net Profit is calculated as Capital Gains minus Capital Losses for the selected period.
- A positive value means the period has a net gain.
- A negative value means the period has a net loss.
- A value of zero may mean that there was no activity or that gains and losses are balanced.
The supporting information may separately display profitable and unprofitable amounts so that you can understand the components of the result.
Network Investment Volume
Section titled “Network Investment Volume”Network Investment Volume represents the total investment value generated by the network associated with the account, when referral, partner, or network features apply.
A value of zero may mean that the account has no network activity or that the feature does not currently apply.
Total Withdrawal and Total Deposit
Section titled “Total Withdrawal and Total Deposit”Total Withdrawal and Total Deposit help you reconcile cash flow for the selected period.
Use these values together with Deposit and Withdrawal History when the Account Balance changes and you do not remember the related transaction.
Total Investments
Section titled “Total Investments”Total Investments is the number of investments recorded in the selected period. The card may also display the Min Investment and Max Investment.
A high investment count does not indicate quality by itself. A period with many investments may still have a net loss if the Profitable Rate is low or Capital Losses exceed Capital Gains.
Profitable Rate
Section titled “Profitable Rate”Profitable Rate is the percentage of profitable investments out of Total Investments.
For example, if the system displays 148 profitable / 134 unprofitable, the period contains 148 profitable investments and 134 unprofitable investments.
A high Profitable Rate is positive, but always review Net Profit. A high rate can still accompany a net loss when unprofitable investments have larger amounts.
Personal Investment Volume
Section titled “Personal Investment Volume”Personal Investment Volume is the total value you invested during the selected period.
Compare this value with Net Profit and Profitable Rate to understand how effectively the invested capital was used.
Read the Profitable / Unprofitable Ratio chart
Section titled “Read the Profitable / Unprofitable Ratio chart”This chart displays the proportion of profitable and unprofitable investments for the selected period. The center value or nearby label normally shows Total Investments.
Use it to answer:
Were most of my investments profitable during this period?
The chart only compares the number of investments. It does not show the size of gains or losses, so also review Net Profit.
Read the Net Profit Trend chart
Section titled “Read the Net Profit Trend chart”The Net Profit Trend chart compares Net Profit across periods such as Today, This Week, This Month, This Year, and All Time.
These timeframes may overlap. For example, This Month includes Today and This Week when they are inside the same month. Therefore, use the chart for quick comparison between reporting scopes, not as a continuous cumulative-growth curve.
Quick review before investing
Section titled “Quick review before investing”Before starting another investment:
- Check Total Balance and Pending.
- Select Today or This Month under Investment Performance.
- Review Net Profit.
- Review Profitable Rate.
- Review Personal Investment Volume.
- If the values appear unusual, open Detailed Analytics or Analytics Details.
Common situations
Section titled “Common situations”Profitable Rate is high, but Net Profit is negative
Section titled “Profitable Rate is high, but Net Profit is negative”This can happen when unprofitable investments have larger losses than the total gains from profitable investments. Review Capital Gains, Capital Losses, Personal Investment Volume, and the Investment Amount Range.
Timeframe values do not look like a continuous trend
Section titled “Timeframe values do not look like a continuous trend”Today, This Week, This Month, This Year, and All Time are different aggregated reporting scopes. They are not always independent points on one continuous timeline.