Invest Page Layout
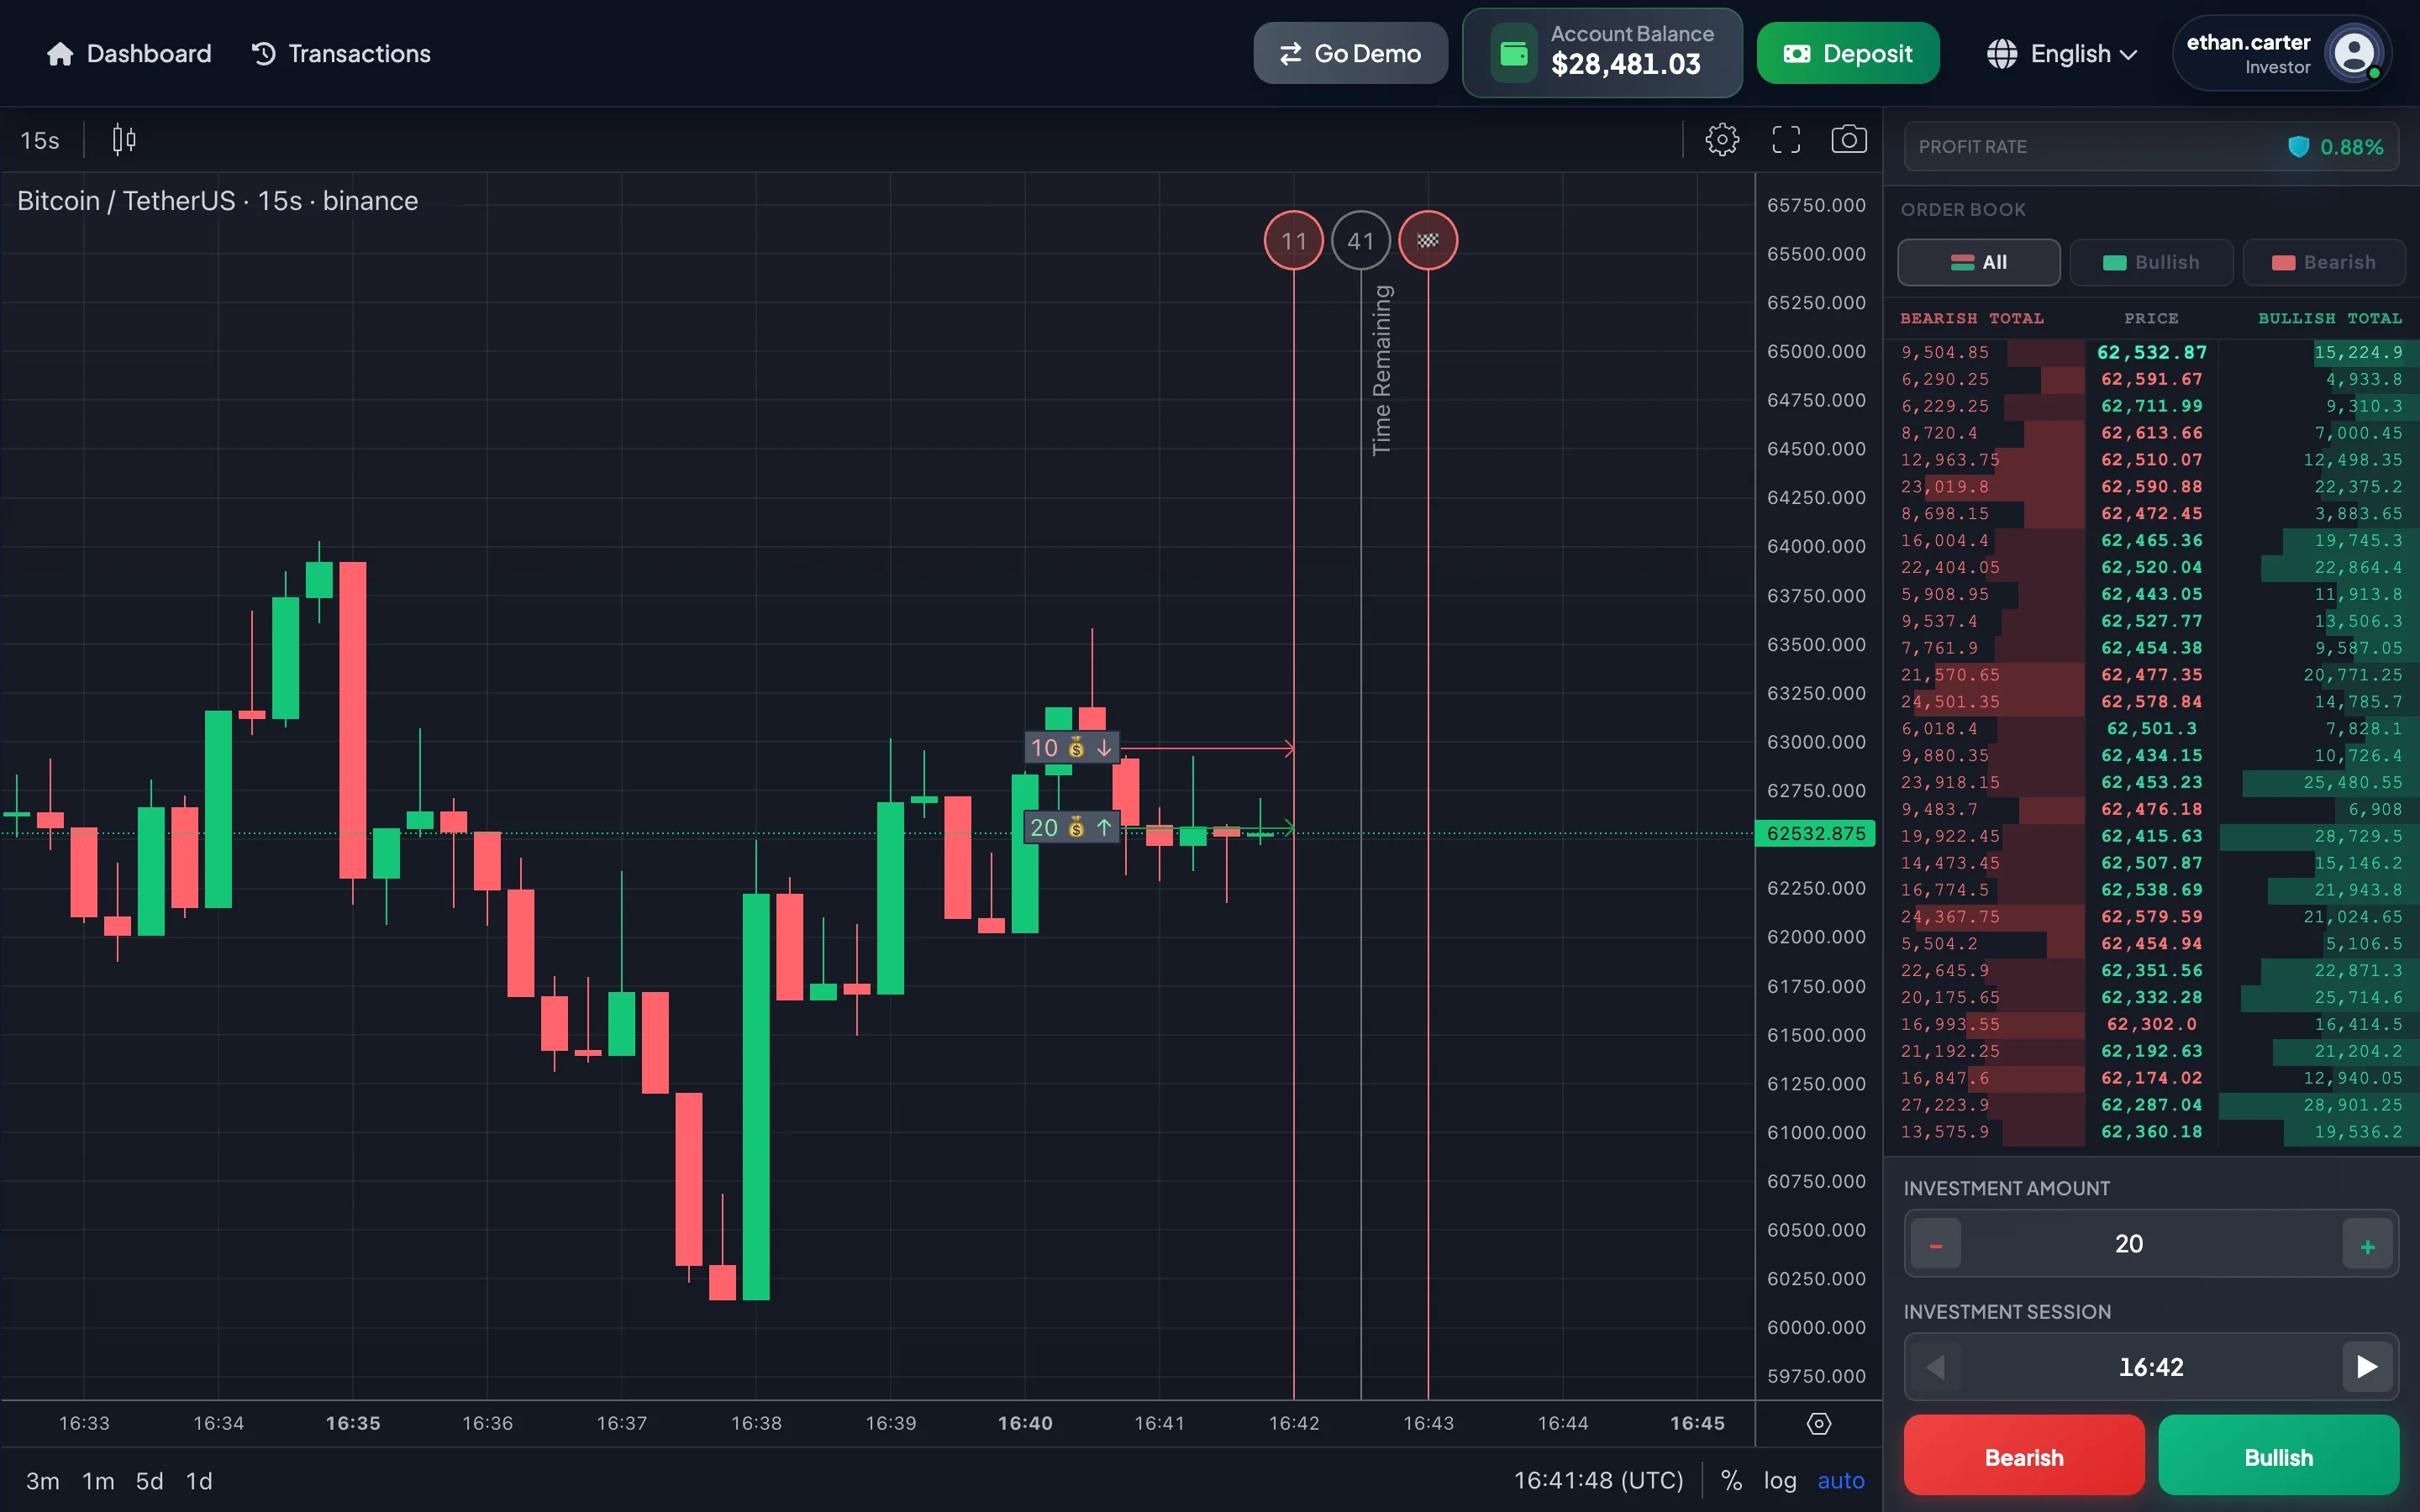
The Invest page is designed so that you can monitor price movement and place investments from the same screen. It normally includes a navbar at the top, an investment panel on one side, the price chart in the main area, and an Order Book for reviewing recent capital flow.
Navbar
Section titled “Navbar”Use the navbar to confirm the current status before placing an investment.
| Component | Meaning |
|---|---|
| Real-time balance | The currently available Account Balance. It may update when a session is settled. |
| Go Demo | Switches to practice mode without using real funds. |
| Go Live | Switches to Real mode and uses the real Account Balance. |
| Trade History | Opens the quick history popup for recent investments. |
| Selected pair | The Market Pair currently being monitored and used for investment. |
Always check the navbar before selecting Bullish or Bearish so that you know which mode is active.
Investment panel
Section titled “Investment panel”The investment panel is where you configure an investment.
| Component | How to use it |
|---|---|
| Investment Amount | Enter the USDT amount. You may use -, +, or quick amounts such as $5, $10, $20, $50, $100, $200, $500, or $1000. |
| Investment Session | The session shown in HH:mm UTC. |
| Previous / Next | Moves to a previous or future session within the allowed range. |
| Profit Rate | The Profit Rate for the selected Market Pair and your Current Level. |
| Bearish | Places an investment in the downward direction. |
| Bullish | Places an investment in the upward direction. |
On some devices, the investment panel may be collapsed. On mobile, you may see a prompt such as “Swipe up for controls” and quick Bullish/Bearish buttons.
Price chart
Section titled “Price chart”The chart is the main monitoring area. Use it to review recent price movement, trend, candles, the price axis, the time axis, and session markers.
Depending on the chart configuration, you may be able to:
- Zoom in or out.
- Drag the chart through time.
- Review candles.
- Follow the current price line.
- Read the price axis on the right.
- Read the time axis at the bottom.
- View Invest lines and Finish lines.
- View order tags for sessions in which you placed an investment.
Timeline and order tags
Section titled “Timeline and order tags”The Invest page uses two important time markers:
| Marker | Meaning |
|---|---|
| Invest line | The deadline for placing an investment in the selected session. |
| Finish line | The point at which the session ends and the result is settled. |
If you place an investment in a session, the chart may draw an order tag near that session’s Finish line. The tag helps you identify the session, direction, and approximate entry price.
Order Book
Section titled “Order Book”The Order Book displays recent Bullish and Bearish capital flow. It has three tabs:
| Tab | Purpose |
|---|---|
| All | Displays Bearish Total, Price, and Bullish Total on the same row. |
| Bullish | Displays only Bullish-side snapshots. |
| Bearish | Displays only Bearish-side snapshots. |
The Order Book is not a guaranteed signal. It only helps you understand which side currently has more capital in the displayed data window.
Result popup
Section titled “Result popup”When a session ends, the old session lines may disappear and a result popup may appear. The popup indicates whether the investment was profitable, whether the balance changed, and which session was settled.
Checklist before placing an investment
Section titled “Checklist before placing an investment”Before placing an investment in Real mode, verify:
- The selected Market Pair is correct.
- The correct mode is active: Demo mode or Real mode.
- The Account Balance is sufficient.
- The Investment Amount is correct.
- The selected Investment Session is correct.
- There is still enough time before the Invest line.
- The selected direction, Bullish or Bearish, is correct.